Fig. 12
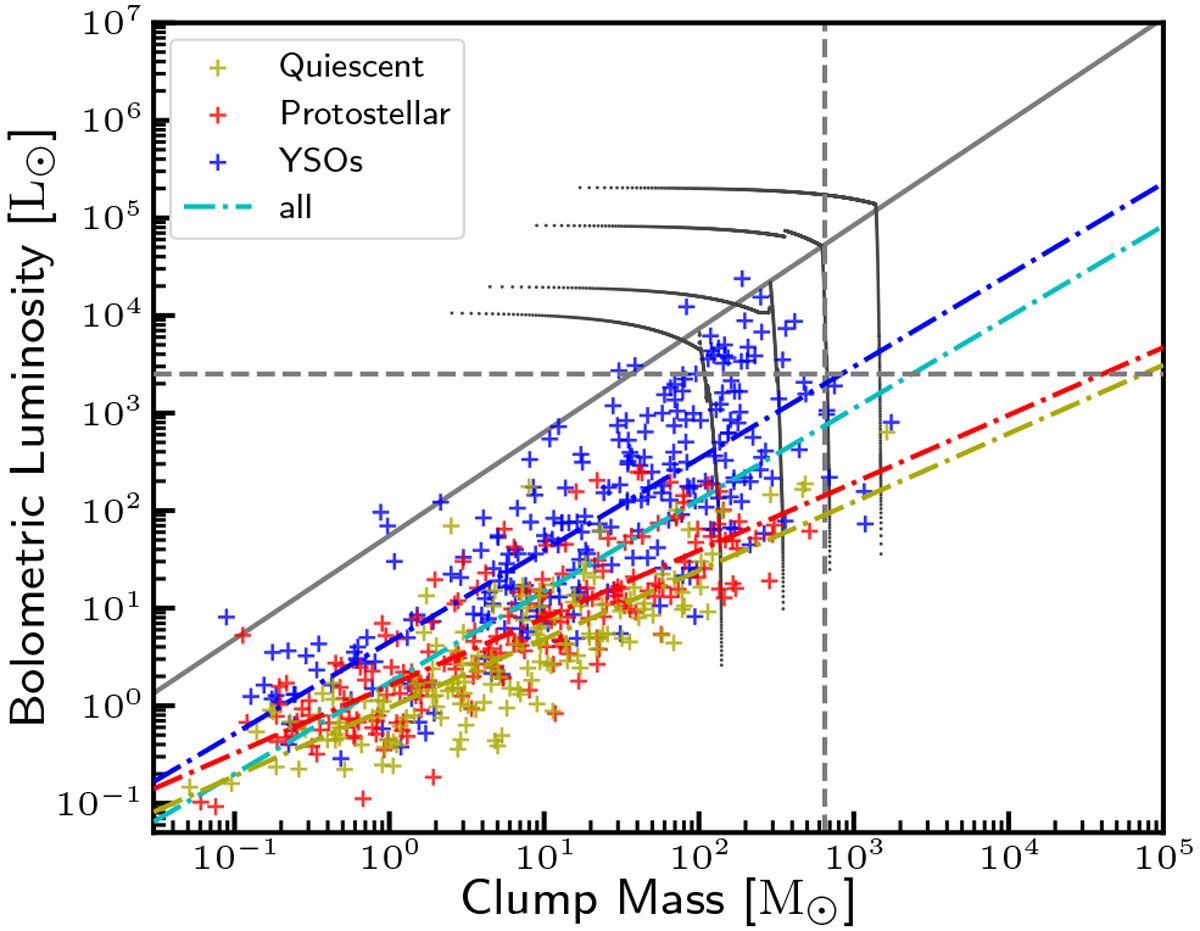
Bolometric luminosity versus clump mass. The gray tracks indicate the evolutionary path through the diagram for the given initial masses as calculated by Molinari et al. (2008). The diagonal solid line marks the expected luminosity for a given mass for a zero-age main-sequence (ZAMS) star. The horizontal dashed line indicates the expected luminosity for a B2 star (~ 8M⊙) as calculated by Mottram et al. (2011). The vertical dashed line marks the threshold calculated by Csengeri et al. (2014) above whichthe clumps are likely to host massive dense cores or a high-mass protostar. The dash-dotted lines are linear fits to the three evolutionary classes.
Current usage metrics show cumulative count of Article Views (full-text article views including HTML views, PDF and ePub downloads, according to the available data) and Abstracts Views on Vision4Press platform.
Data correspond to usage on the plateform after 2015. The current usage metrics is available 48-96 hours after online publication and is updated daily on week days.
Initial download of the metrics may take a while.