Fig. 10
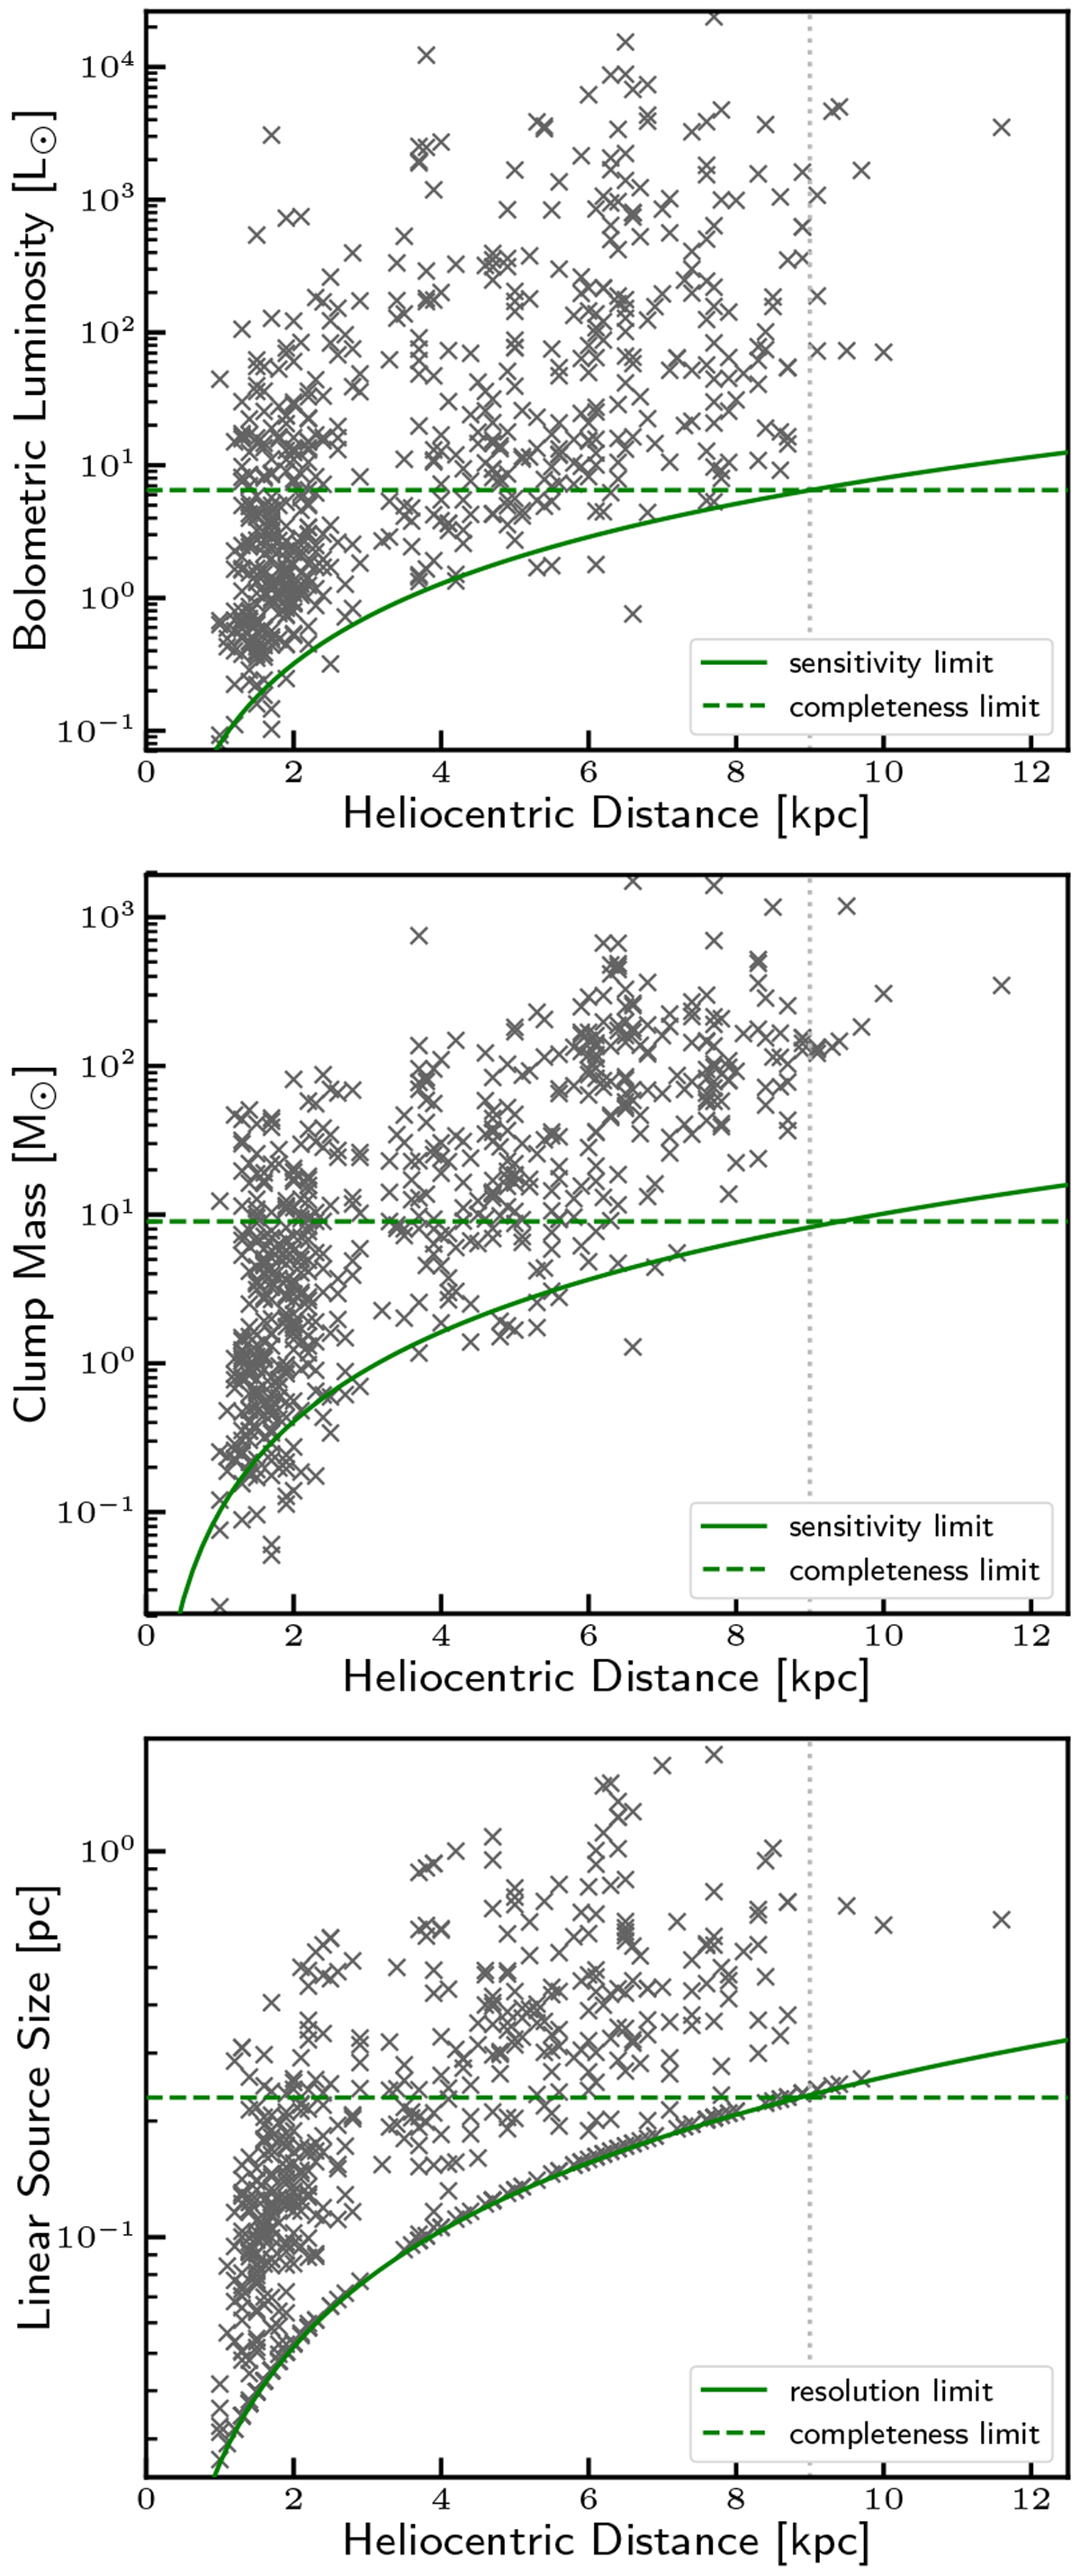
Observational distance biases. Bolometric luminosity (top), clump mass (middle), and linear source size (bottom) versus heliocentric distance. The solid lines mark the distance-dependent sensitivity/resolution limit. The horizontally dashed green lines mark the limit above which our survey does not suffer from a distance bias up to 9 kpc (vertical dotted line).
Current usage metrics show cumulative count of Article Views (full-text article views including HTML views, PDF and ePub downloads, according to the available data) and Abstracts Views on Vision4Press platform.
Data correspond to usage on the plateform after 2015. The current usage metrics is available 48-96 hours after online publication and is updated daily on week days.
Initial download of the metrics may take a while.