Fig. 9.
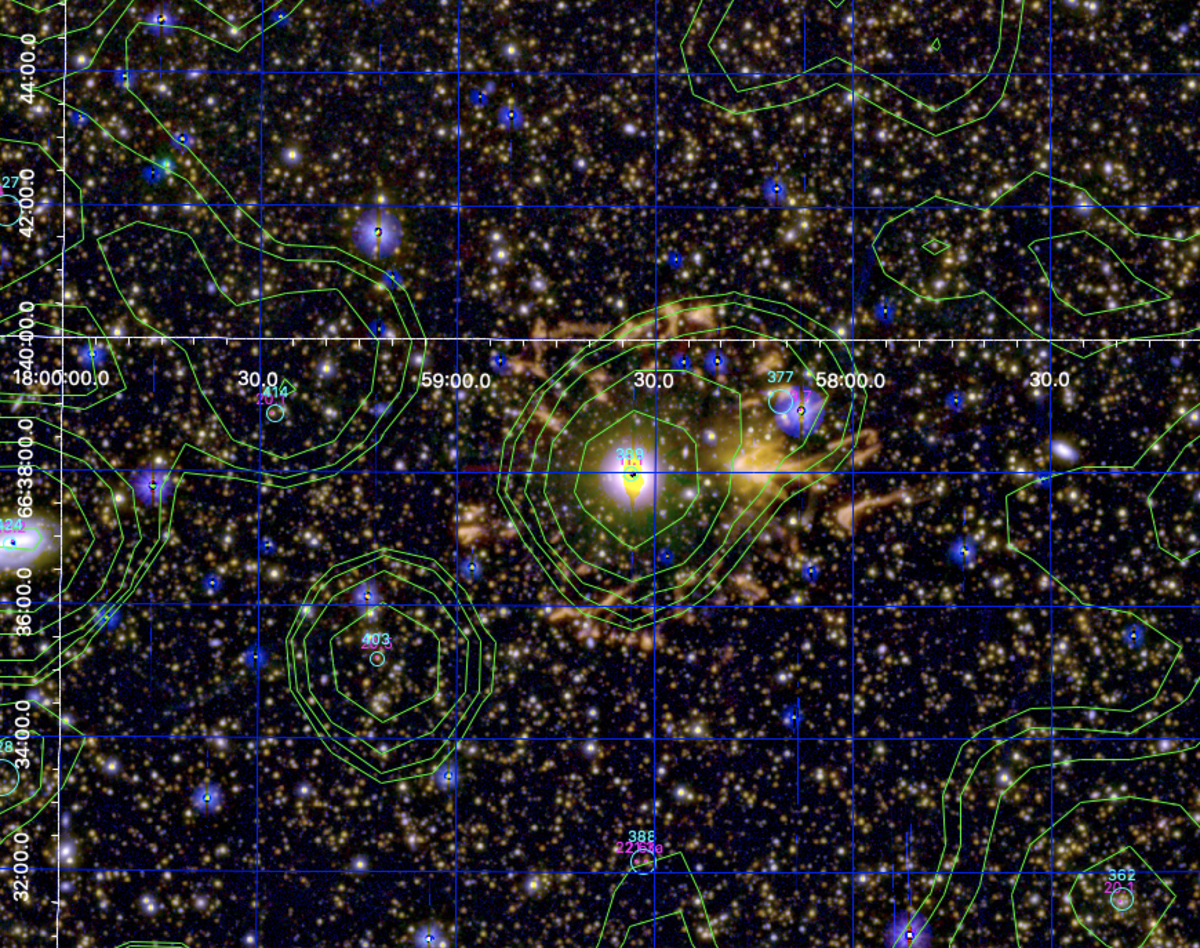
Cutout (18′×15′) of the centre of the HEROES field. ROSAT X-ray contours (green) are superposed on a false-colour optical–mid-IR image with the HSC i band in blue and the Spitzer I1 and I2 bands in green and red, respectively. ML X-ray error circles are shown in cyan with the radius of 2σ. Optical counterpart magnitudes are indicated in magenta.
Current usage metrics show cumulative count of Article Views (full-text article views including HTML views, PDF and ePub downloads, according to the available data) and Abstracts Views on Vision4Press platform.
Data correspond to usage on the plateform after 2015. The current usage metrics is available 48-96 hours after online publication and is updated daily on week days.
Initial download of the metrics may take a while.