Fig. 8.
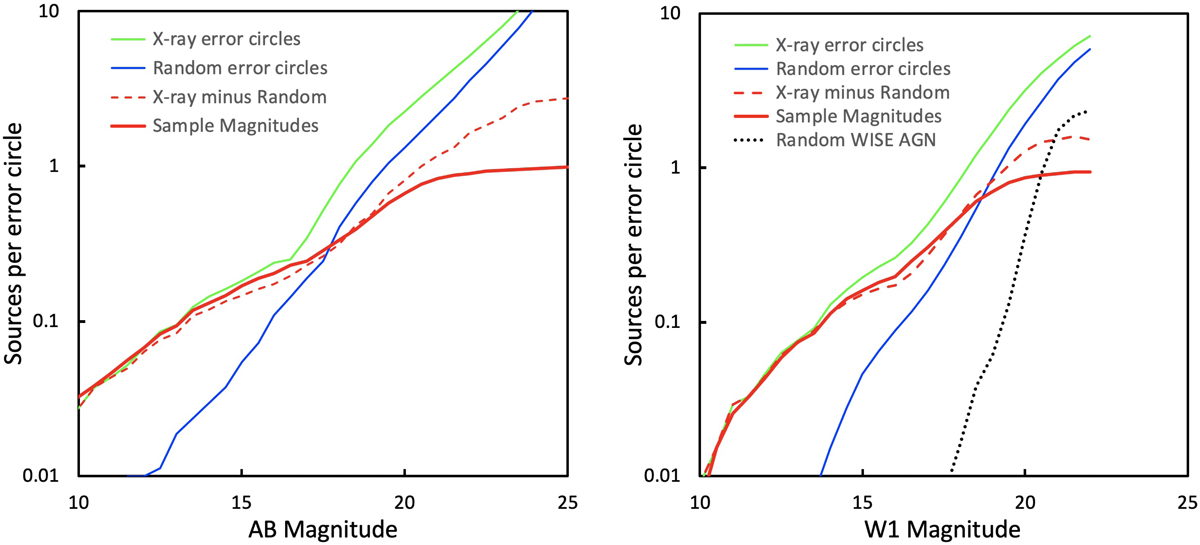
Cumulative magnitude distributions in circles with 2.5σ error radii around the 805 X-ray sources (green line), and the same number of randomly chosen positions (blue line). The dashed red line shows the difference between source and random circles, while the thick red line shows the actual magnitude distribution of the X-ray counterparts. Left: Subaru HSC i band. Right: CatWISE2020 W1 band. The dotted black line shows the cumulative distribution of random mid-IR selected AGN candidates with W1 − W2 > 0.8.
Current usage metrics show cumulative count of Article Views (full-text article views including HTML views, PDF and ePub downloads, according to the available data) and Abstracts Views on Vision4Press platform.
Data correspond to usage on the plateform after 2015. The current usage metrics is available 48-96 hours after online publication and is updated daily on week days.
Initial download of the metrics may take a while.