Fig. 7.
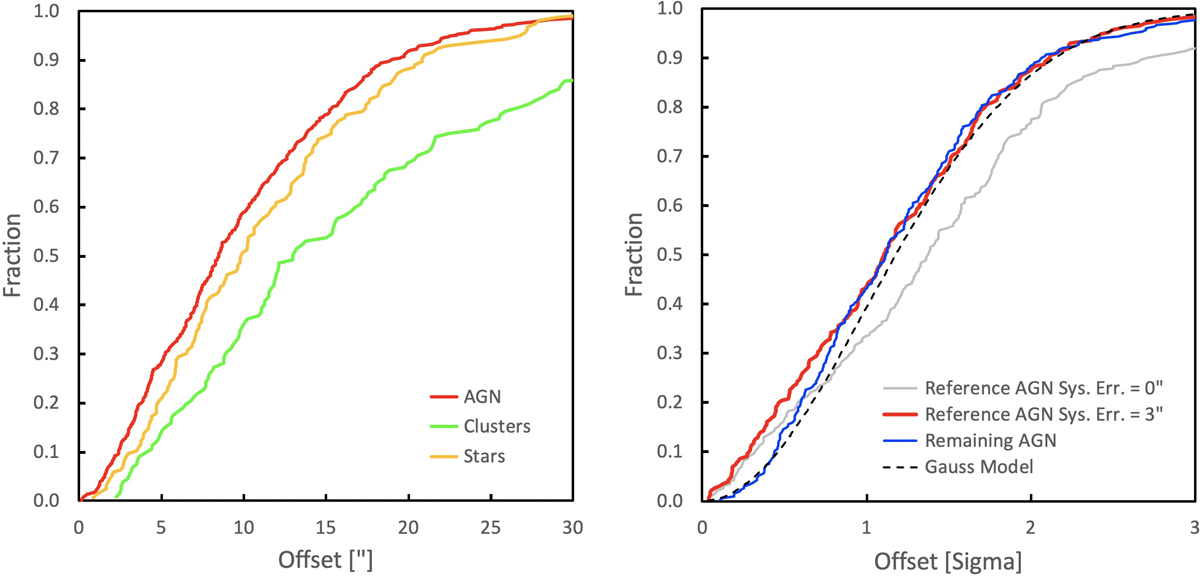
Left: cumulative distribution of position offsets (in arcseconds) for different classes of sources. AGN have a narrow distribution with a half-radius of 8.5″, while stars have a slightly wider distribution (9.8″), indicating some possible misidentification among ∼15% of the stars. Clusters and groups have an even wider distribution because the X-ray emission is not always centred on the brightest galaxy. Right: cumulative distribution of position offsets in units of the 1σ position errors compared to a Gaussian model (black dashes). The grey line shows the distribution for 231 high-quality reference AGN (see text) before the application of a systematic position error. The red line shows the same 231 reference AGN after a systematic position error of 3″ has been applied to each statistical error. The blue line shows the offset distribution for the remaining 301 AGN applying the same 3″ systematic position error.
Current usage metrics show cumulative count of Article Views (full-text article views including HTML views, PDF and ePub downloads, according to the available data) and Abstracts Views on Vision4Press platform.
Data correspond to usage on the plateform after 2015. The current usage metrics is available 48-96 hours after online publication and is updated daily on week days.
Initial download of the metrics may take a while.