Fig. 2.
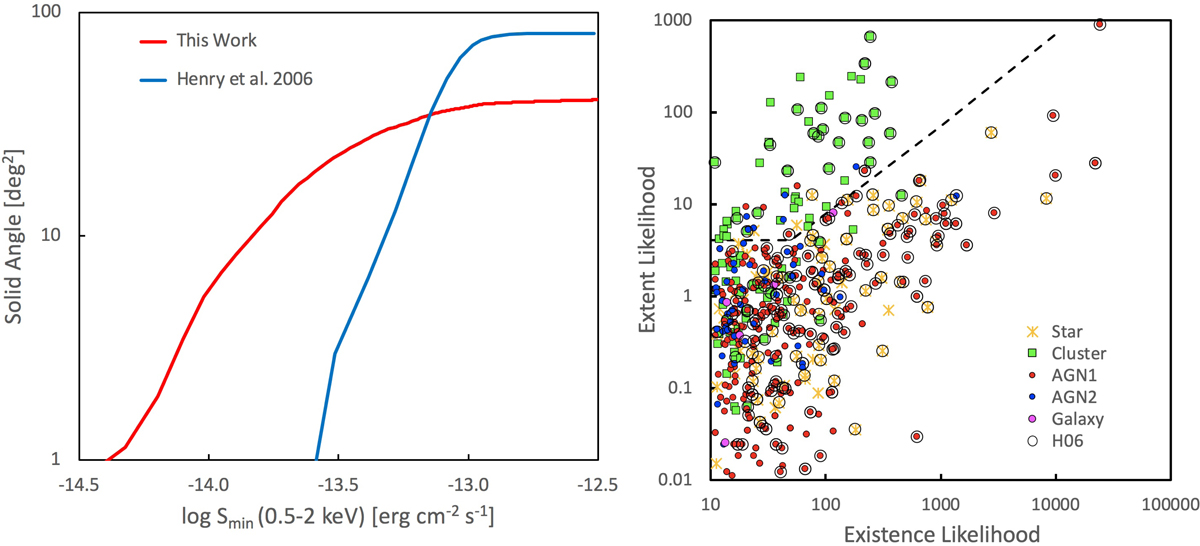
Left: ROSAT NEP Raster Survey sensitivity function (red) compared with the RASS NEP survey of H06 (blue). Right: characterization of extended sources in the diagram of existence vs. extent likelihood. Red circles correspond to AGN1, blue circles to AGN2, pink circles to normal galaxies, green squares to clusters of galaxies, and yellow asterisks to stars. Black circles around the symbols indicate sources from the H06 catalogue. This figure, and the corresponding following figures, are only shown for the unique optical counterparts (see Sect. 4.4). Bright point sources (AGN, stars) appear to be extended because of the imperfect description of the PSF in the ML algorithm. The dashed line shows an empirical separation between true and spurious extension.
Current usage metrics show cumulative count of Article Views (full-text article views including HTML views, PDF and ePub downloads, according to the available data) and Abstracts Views on Vision4Press platform.
Data correspond to usage on the plateform after 2015. The current usage metrics is available 48-96 hours after online publication and is updated daily on week days.
Initial download of the metrics may take a while.