Fig. 15.
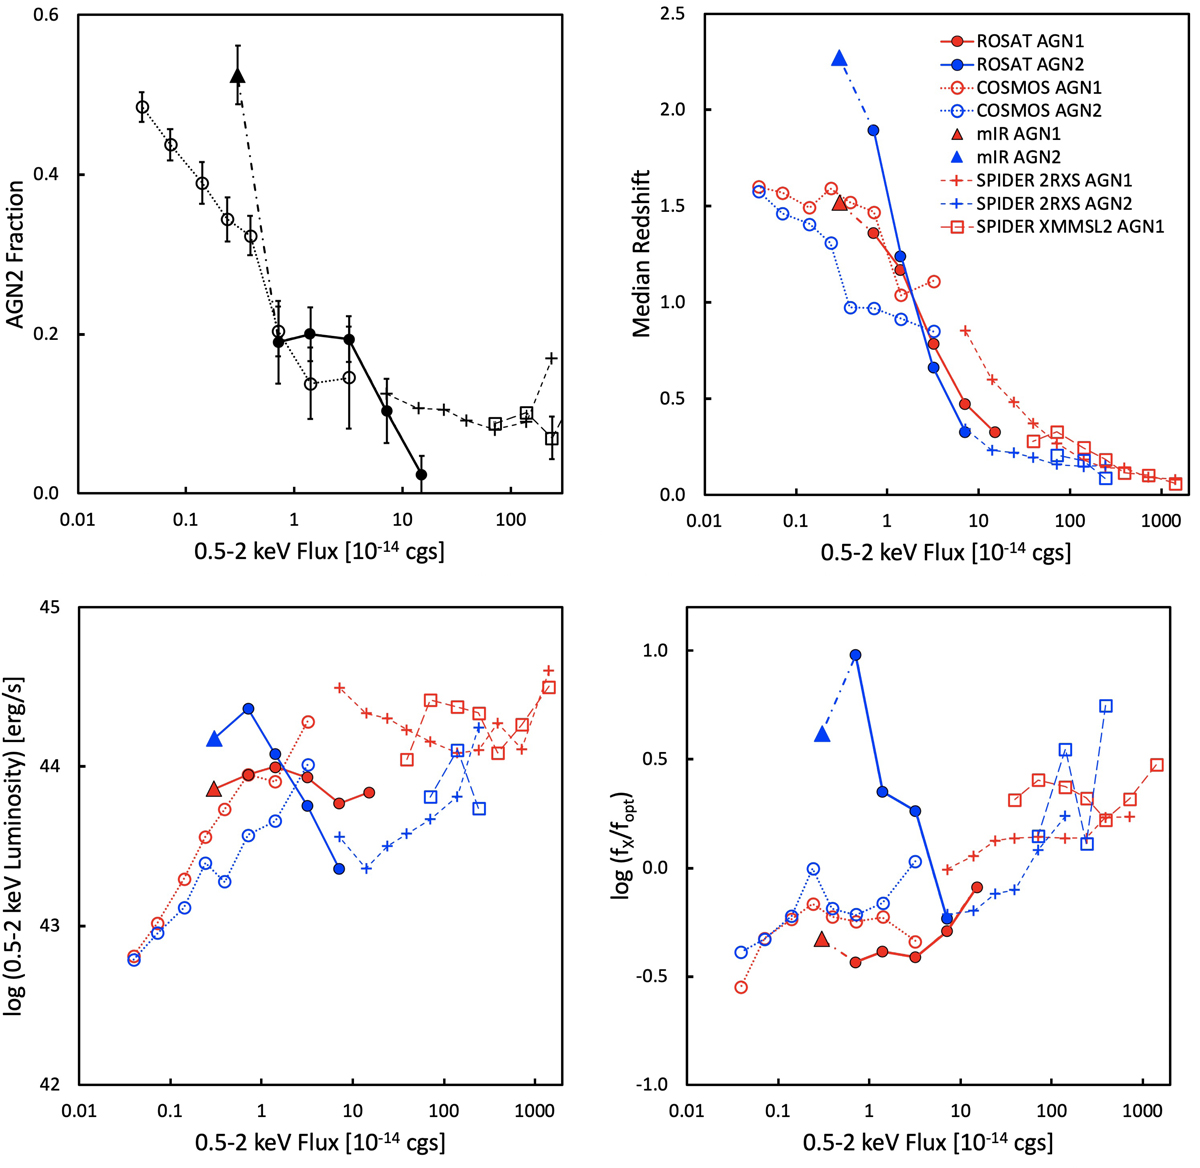
Ensemble properties of AGN1 (red) and AGN2 (blue) grouped by X-ray flux. Filled symbols show the ROSAT NEP sample, open symbols the soft-band detected Chandra COSMOS sample. The triangles show the upper limits for the mid-IR selected AGN sample. Upper left panel: median redshifts. Upper right panel: median X-ray luminosities, and lower left: median X-ray–to–optical flux ratios. Finally, the lower right panel shows the AGN2 fraction (AGN/(AGN1 + AGN2) as a function of soft X-ray flux.
Current usage metrics show cumulative count of Article Views (full-text article views including HTML views, PDF and ePub downloads, according to the available data) and Abstracts Views on Vision4Press platform.
Data correspond to usage on the plateform after 2015. The current usage metrics is available 48-96 hours after online publication and is updated daily on week days.
Initial download of the metrics may take a while.