Fig. 13.
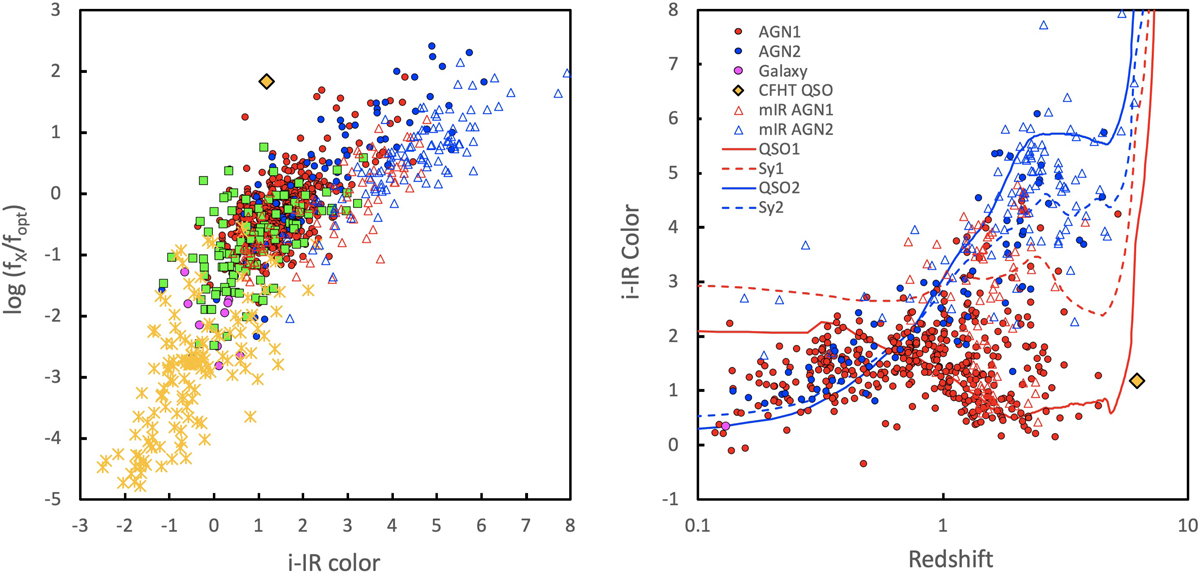
Left: X-ray–to–optical flux ratio fXO vs. the optical to infrared colour i–IR (symbols are the same as in Fig. 6, but with the addition of the of mid-IR selected AGN candidates as in Fig. 10). Right: optical to infrared colour i–IR as a function of redshift for AGN1 (red), AGN2 (blue), and galaxies (magenta). SED models for QSO1, QSO2, Sy1, and Sy2 from the photometric redshift fits are overplotted (see legend).
Current usage metrics show cumulative count of Article Views (full-text article views including HTML views, PDF and ePub downloads, according to the available data) and Abstracts Views on Vision4Press platform.
Data correspond to usage on the plateform after 2015. The current usage metrics is available 48-96 hours after online publication and is updated daily on week days.
Initial download of the metrics may take a while.