Fig. 11.
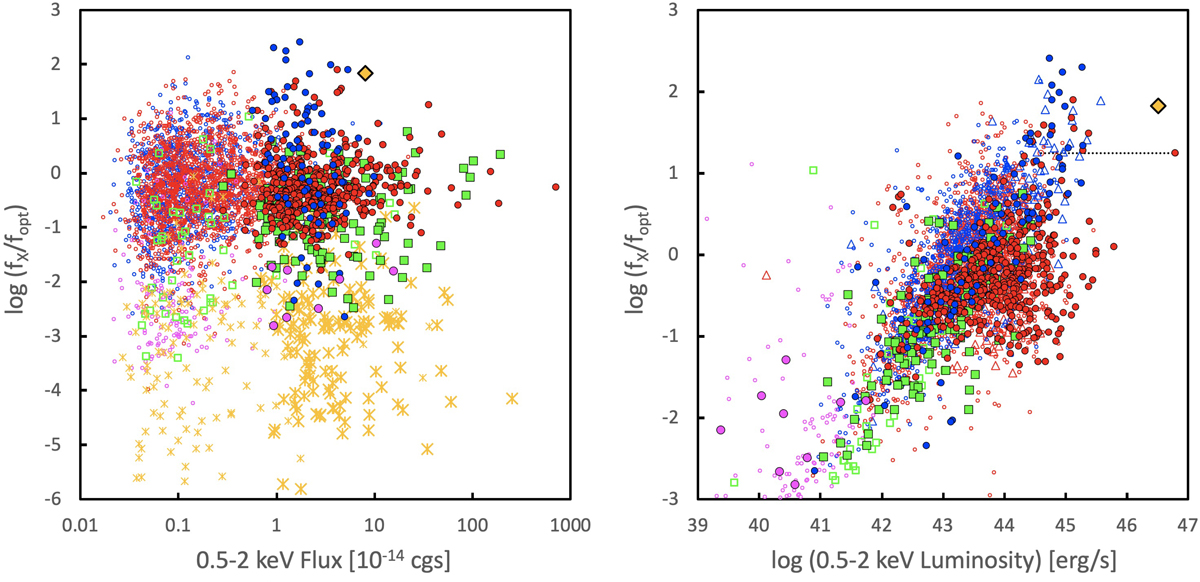
Left: X-ray–to–optical flux ratio fXO vs. X-ray flux. Shown are the ROSAT NEP raster scan catalogue objects (colours as in Fig. 6 without the H06 objects indicated); at fainter fluxes the objects from the largely spectroscopically identified Chandra legacy survey of the COSMOS field (Marchesi et al. 2016) are also shown (small open symbols and the same colours). The large orange diamond gives the position of the highest-redshift radio loud quasar CFHQS J142952+544717 recently identified in the eROSITA all-sky survey (Medvedev et al. 2020). Right: X-ray–to–optical flux ratio vs. X-ray luminosity. Same symbols as the left figure, but the upper limits from the mid-IR AGN candidates are added as red and blue triangles. The dotted line refers to the highest-luminosity object XID803, which has a second photometric redshift solution at lower luminosity.
Current usage metrics show cumulative count of Article Views (full-text article views including HTML views, PDF and ePub downloads, according to the available data) and Abstracts Views on Vision4Press platform.
Data correspond to usage on the plateform after 2015. The current usage metrics is available 48-96 hours after online publication and is updated daily on week days.
Initial download of the metrics may take a while.