Fig. 10.
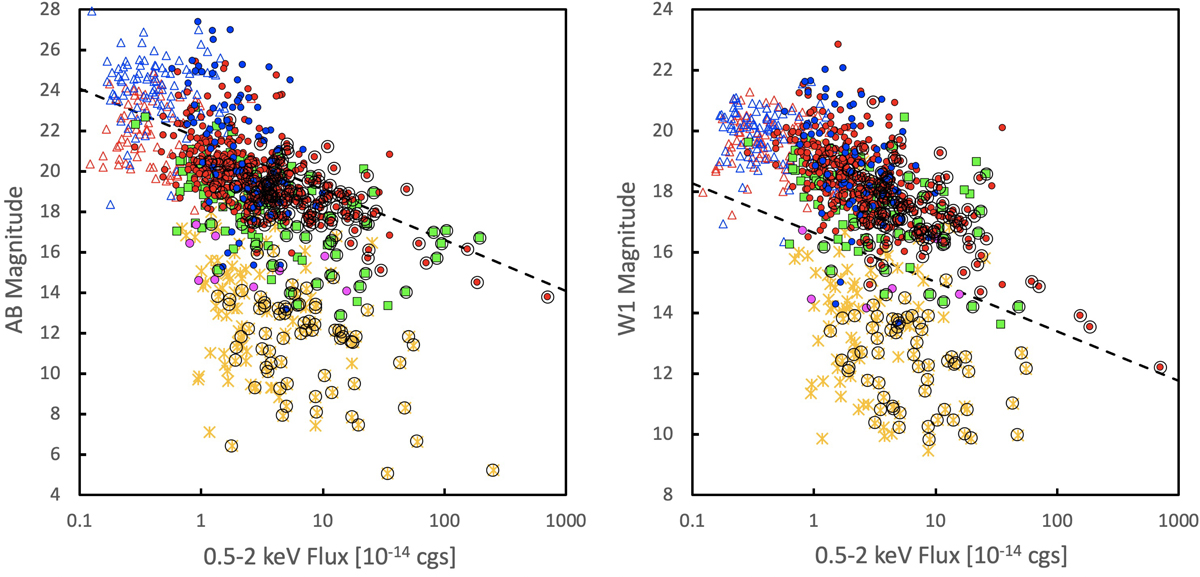
Left: AB magnitude vs. X-ray flux. The symbols are the same as in Fig. 2 (right); also shown are the X-ray upper limit fluxes for a sample of AGN candidates selected from mid-IR colours (red triangles for AGN1 candidates and blue triangles for AGN2 candidates). The dashed line indicates an X-ray–to–optical flux ratio of fXO = 1. Right: as in the left figure, but with the CatWISE2020 W1 magnitude on the x-axis. Here the dashed line shows the empirical discrimination between AGN and other objects defined in Salvato et al. (2018).
Current usage metrics show cumulative count of Article Views (full-text article views including HTML views, PDF and ePub downloads, according to the available data) and Abstracts Views on Vision4Press platform.
Data correspond to usage on the plateform after 2015. The current usage metrics is available 48-96 hours after online publication and is updated daily on week days.
Initial download of the metrics may take a while.