Fig. 8
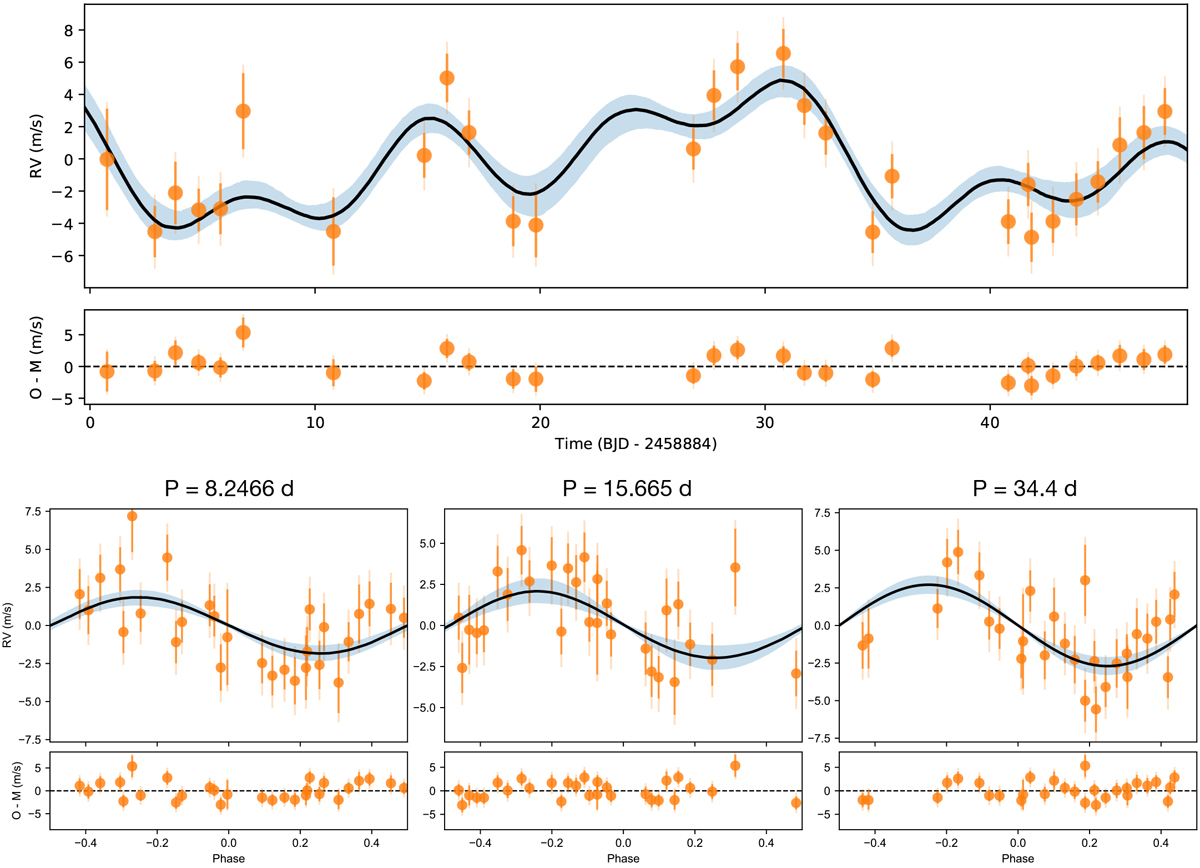
Top panel: time series of the HARPS serval RVs and the best model discussed in Sect. 5.2.2 and the residuals from the fit below. The blue shaded area corresponds to the 1σ confidence interval of the model. Bottom panel: RVs phase-folded to the period (shown above each panel) of the two confirmed planets (TOI-776 b, left; TOI-776 c, center) and the additional sinusoid associated with the stellar variability. In both panels, the error bars of the RV data have the extra jitter term added in quadrature and plotted in a lighter orange for visualization.
Current usage metrics show cumulative count of Article Views (full-text article views including HTML views, PDF and ePub downloads, according to the available data) and Abstracts Views on Vision4Press platform.
Data correspond to usage on the plateform after 2015. The current usage metrics is available 48-96 hours after online publication and is updated daily on week days.
Initial download of the metrics may take a while.