Fig. 7
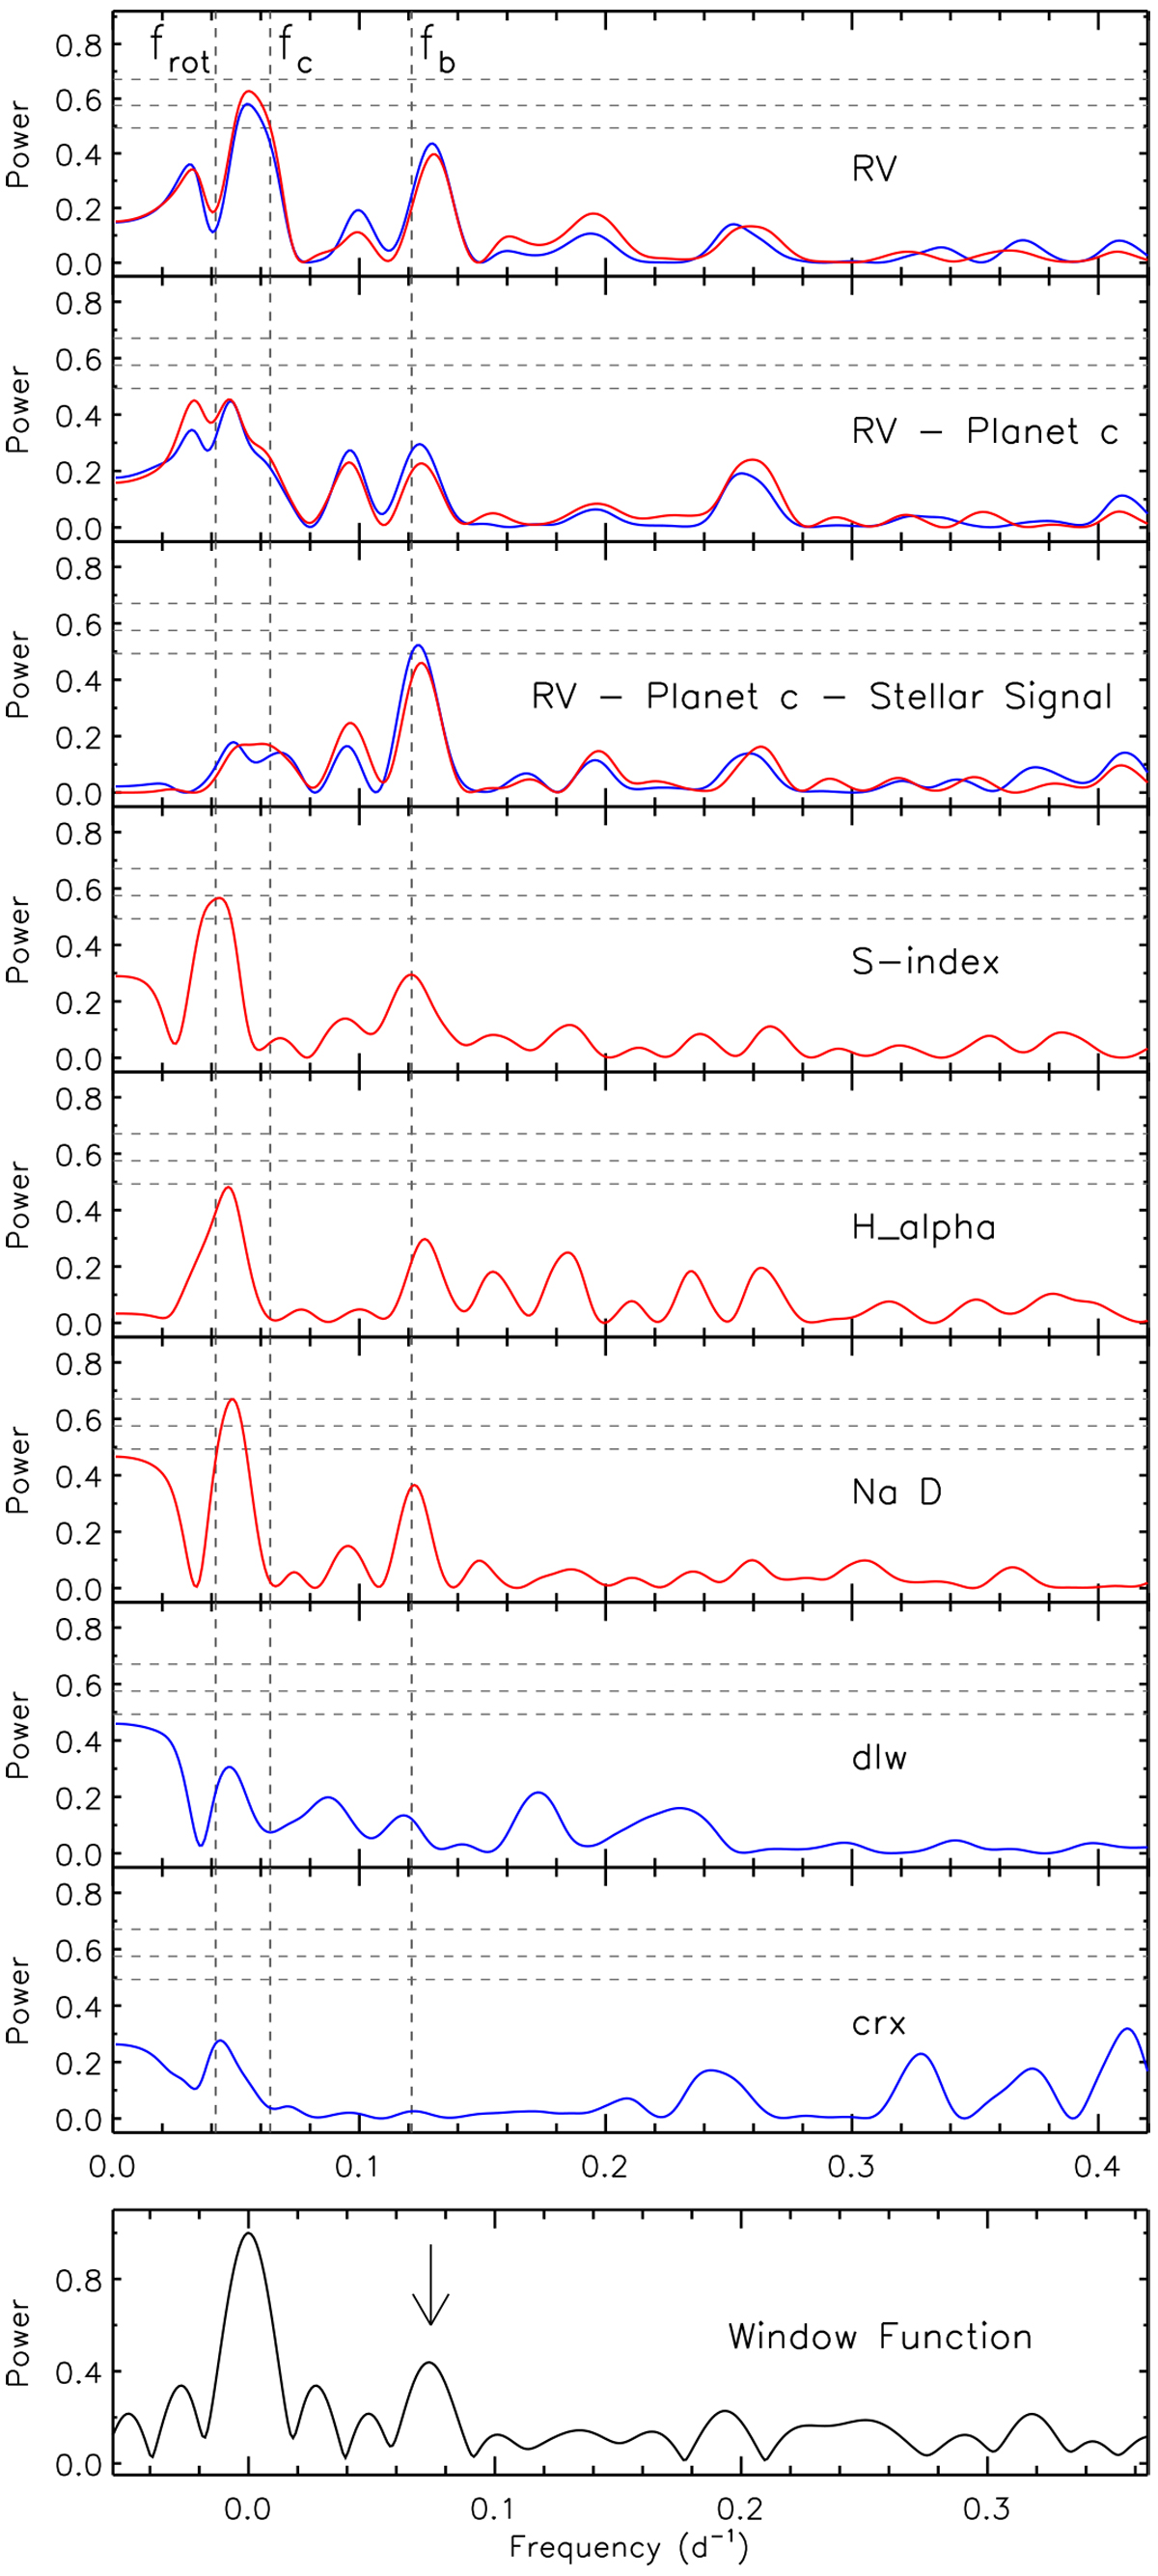
Generalized Lomb-Scargle periodograms of the HARPS RVs and spectral activity indicators from serval (blue) andTERRA (red). The horizontal dashed lines mark, from bottom to top, the 5, 1, and 0.1% FAP levels, respectively. The vertical dashed lines mark the orbital frequencies of the two transiting planets (f b = 0.121 d−1 and f c = 0.064 d−1) and of the stellar signal at ~0.03 d−1. Upper panel: HARPS RVs. Second panel: RV residuals following the subtraction of the signal of TOI-776 c. Third panel: RV residuals following the subtraction of the reflex motion of TOI-776 c and of the activity-induced stellar signal. Fourth panel: S-index. Fifth panel: Hα line. Sixth panel: Na D lines. Seventh panel: differential line width (dLW). Eighth panel: chromatic index (CRX). Bottom panel: window function. The arrow in the bottom panel indicates the peak at 0.07 d−1 referred to in the discussion of Sect. 5.1.
Current usage metrics show cumulative count of Article Views (full-text article views including HTML views, PDF and ePub downloads, according to the available data) and Abstracts Views on Vision4Press platform.
Data correspond to usage on the plateform after 2015. The current usage metrics is available 48-96 hours after online publication and is updated daily on week days.
Initial download of the metrics may take a while.