Fig. C.1
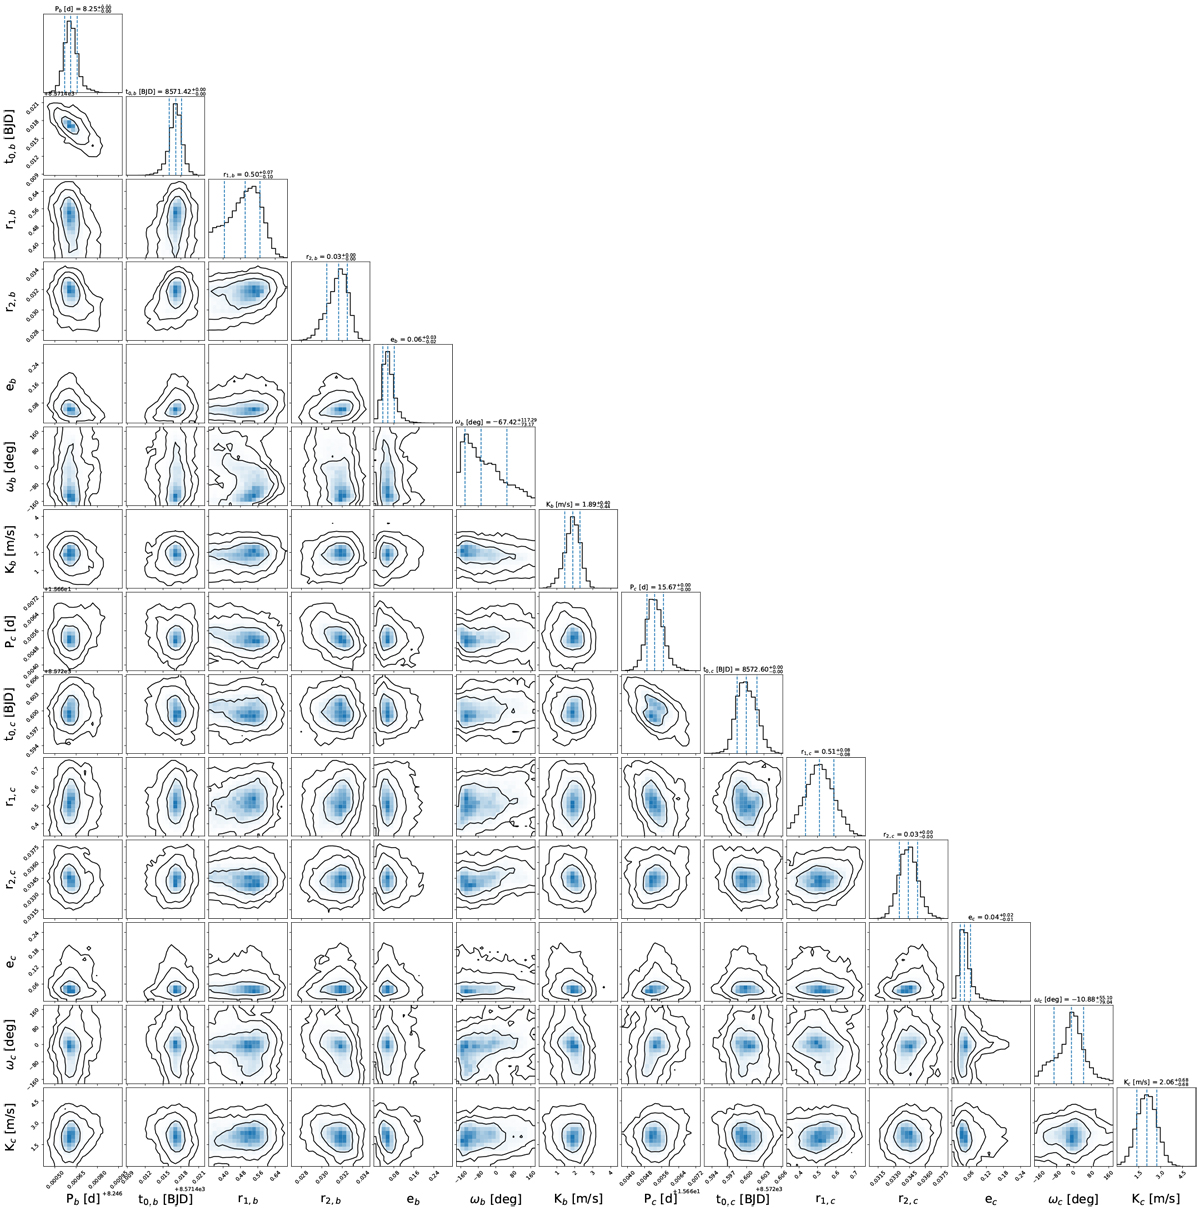
Posterior distributions of the orbital parameters of the TOI-776 system. Each panel contains ~ 220 000 samples. The top panels of the corner plot show the probability density distributions of each orbital parameter. The vertical dashed lines indicate the 16th, 50th, and the 84th percentiles of the samples. Contours are drawn to improve thevisualization of the 2D histograms and indicate the 68.3, 95.5, and 99.7% confidence interval levels (i.e., 1σ, 2σ, and 3σ).
Current usage metrics show cumulative count of Article Views (full-text article views including HTML views, PDF and ePub downloads, according to the available data) and Abstracts Views on Vision4Press platform.
Data correspond to usage on the plateform after 2015. The current usage metrics is available 48-96 hours after online publication and is updated daily on week days.
Initial download of the metrics may take a while.