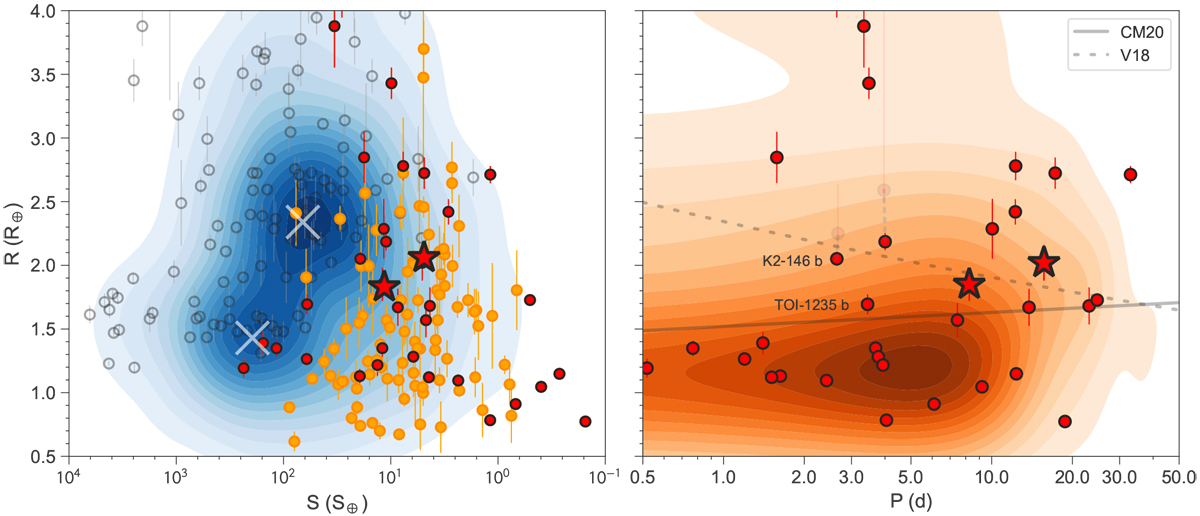
Fig. 12

Insolation-radius (left) and period-radius (right) diagrams in Earth units. In both panels, the different circles represent the same planets as in Fig. 10 from the TEPCat database (Southworth 2011). In the left panel, we plot in blue the R-S point density of all the known confirmed transiting planets with contours, and sub-Neptune and super-Earths’ density maxima with white crosses. In the right panel, the orange contours represent the density of planets around M dwarfs with mass determinations worse than 30% or without mass constraints at all (orange circles in the left panel). The dashed line represents the location of the radius valley for F-, G-, and K-type stars from Van Eylen et al. (2018), consistent with the predictions from photoevaporation and core-powered mass-loss models, while the solid line represents the location of the radius valley for mid-K and mid-M dwarfs from Cloutier & Menou (2020), consistent with gas-poor formation scenarios. Together with TOI-776 b, the other two systems that are within both lines are K2-146 (solid, Hamann et al. 2019; Lam et al. 2020, translucent) and TOI-1235 ( Bluhm et al. 2020; Cloutier et al. 2020).
Current usage metrics show cumulative count of Article Views (full-text article views including HTML views, PDF and ePub downloads, according to the available data) and Abstracts Views on Vision4Press platform.
Data correspond to usage on the plateform after 2015. The current usage metrics is available 48-96 hours after online publication and is updated daily on week days.
Initial download of the metrics may take a while.


