Fig. 8.
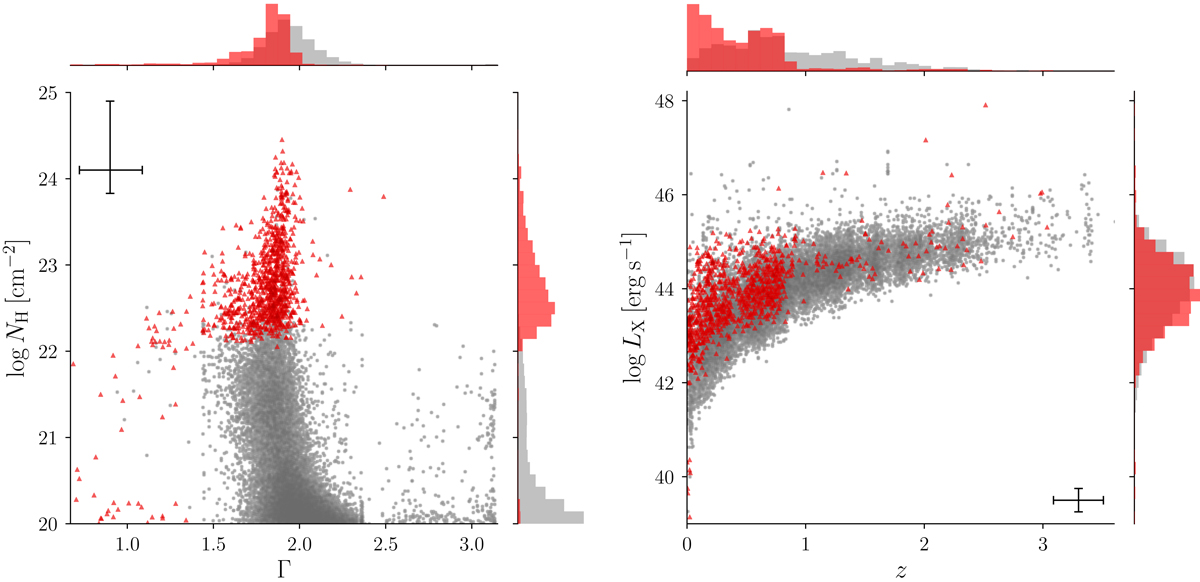
Photon index vs. hydrogen column density (left) and redshift vs. 2–10 keV absorption-corrected luminosity (right) for detections classified as AGNs with reliable X-ray modelling (see Sect. 4). Red triangles are X-ray absorbed AGNs, and unabsorbed AGNs are shown as grey circles. Errors are not included in the plots in order to improve visualisation; instead, we include error bars in the corners showing the median error of the corresponding parameters. The histograms in the upper and right sides of the plots show the normalised distribution of the parameters for X-ray absorbed (red) and unabsorbed AGNs (grey).
Current usage metrics show cumulative count of Article Views (full-text article views including HTML views, PDF and ePub downloads, according to the available data) and Abstracts Views on Vision4Press platform.
Data correspond to usage on the plateform after 2015. The current usage metrics is available 48-96 hours after online publication and is updated daily on week days.
Initial download of the metrics may take a while.