Free Access
Fig. 7.
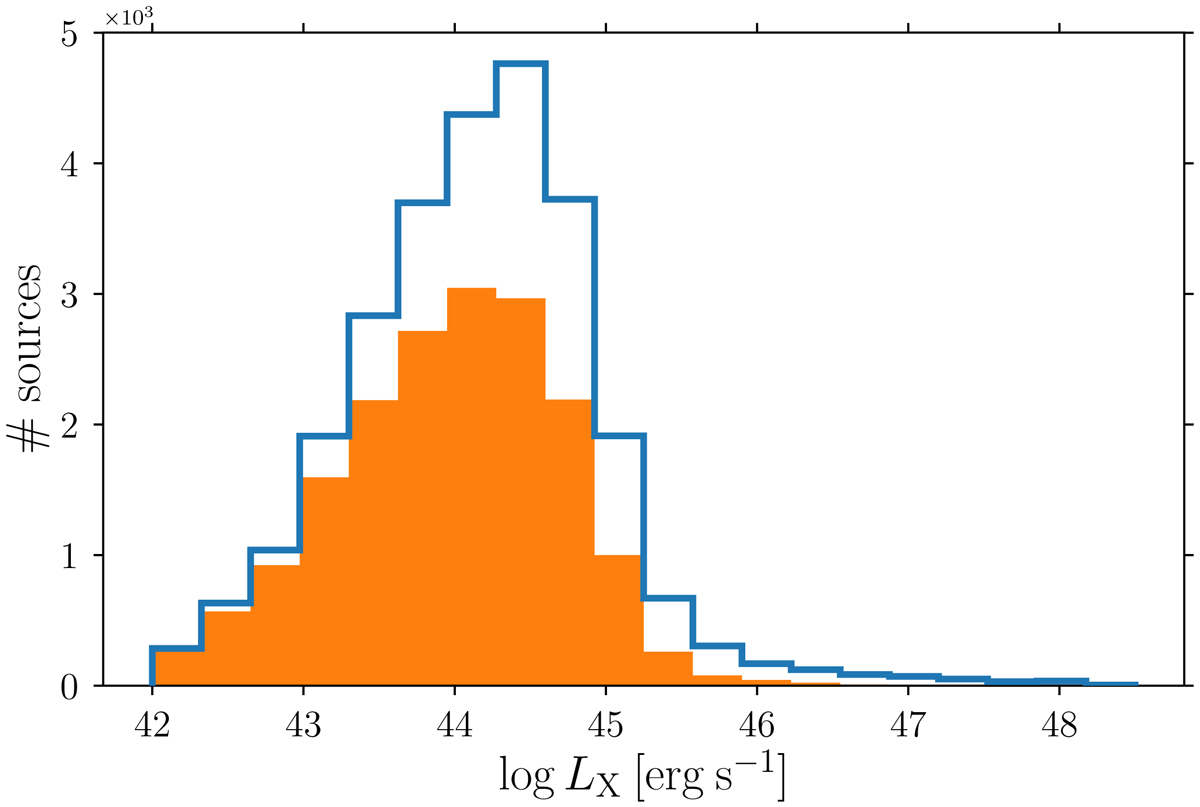
X-ray luminosity distribution for XMMFITCAT-Z sources classified as AGNs. The solid blue line shows the whole sample without any additional filtering. The solid orange histogram includes only AGNs with a reliable best-fit model (see Sect. 4).
Current usage metrics show cumulative count of Article Views (full-text article views including HTML views, PDF and ePub downloads, according to the available data) and Abstracts Views on Vision4Press platform.
Data correspond to usage on the plateform after 2015. The current usage metrics is available 48-96 hours after online publication and is updated daily on week days.
Initial download of the metrics may take a while.