Fig. 5.
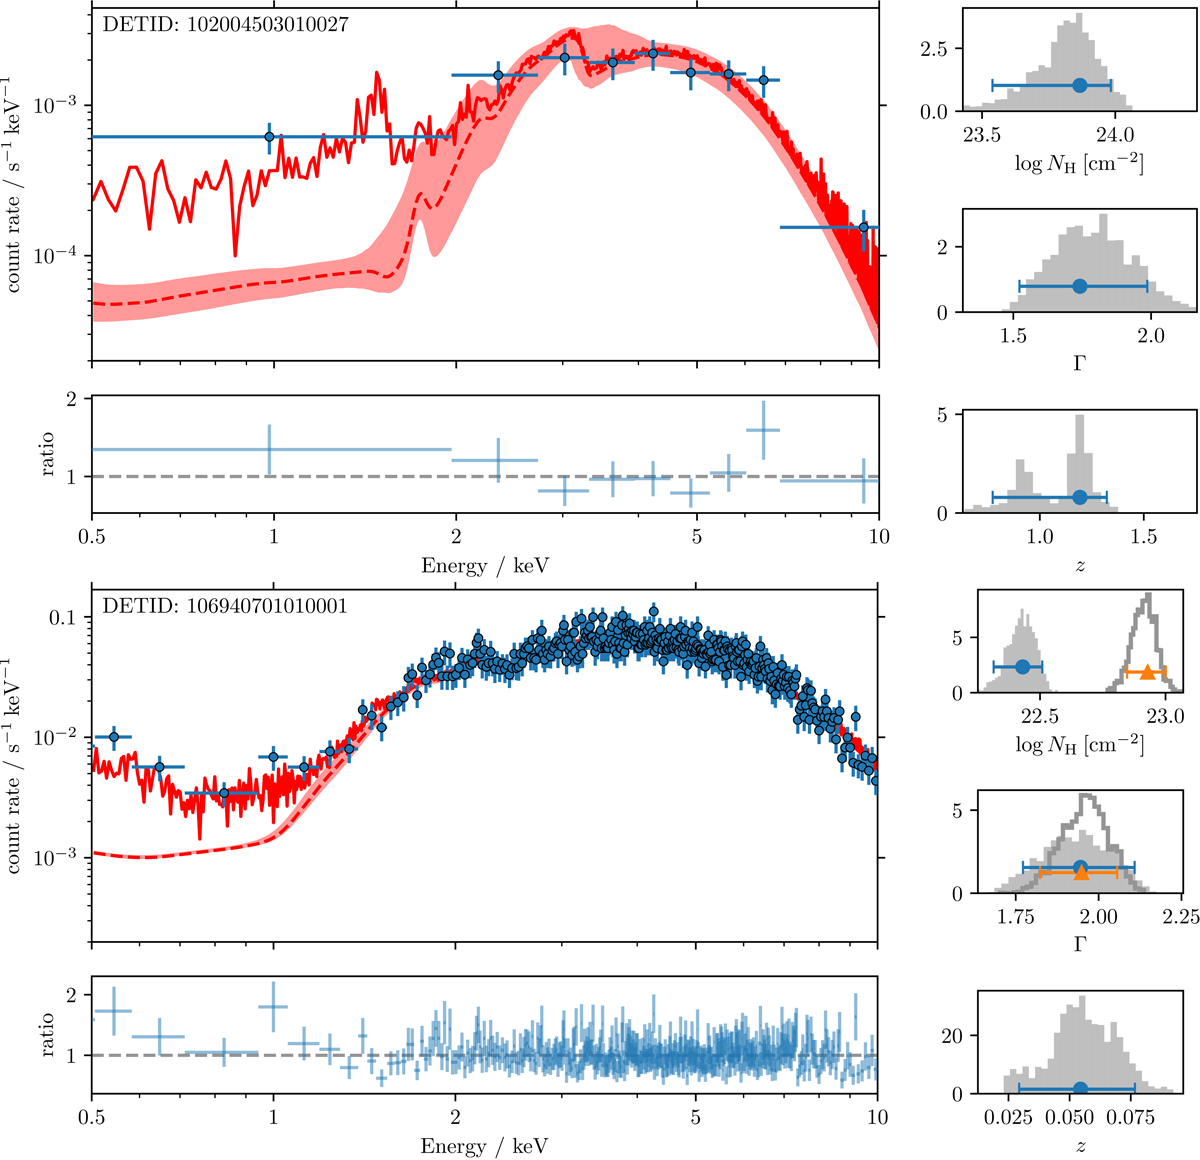
XMM-Newton spectra (EPIC-pn) of two X-ray absorbed AGNs identified through our selection criteria. For improved visualisation, spectral data (blue circles) have been grouped to obtain a signal-to-noise ratio per bin of at least five. Solid red lines show the background plus model and dashed red lines show the model only. Red areas indicate the 2σ model uncertainty. Panels in the lower part of the plots show the ratio between the observed and the model-predicted count rate. Histograms in the right column show the posterior probability distribution of the model parameters; the corresponding best-fit values (mode), and their 90% credible intervals are shown as symbols with error bars. Solid grey histograms and blue circles correspond to the outer model components. Open histograms and orange triangles correspond to the inner model components. Top: detection best fitted with a single absorbed power law (‘wapo’ model). Bottom: detection best fitted using a double power law with two absorbers (‘wapopo’ model).
Current usage metrics show cumulative count of Article Views (full-text article views including HTML views, PDF and ePub downloads, according to the available data) and Abstracts Views on Vision4Press platform.
Data correspond to usage on the plateform after 2015. The current usage metrics is available 48-96 hours after online publication and is updated daily on week days.
Initial download of the metrics may take a while.