Fig. 3.
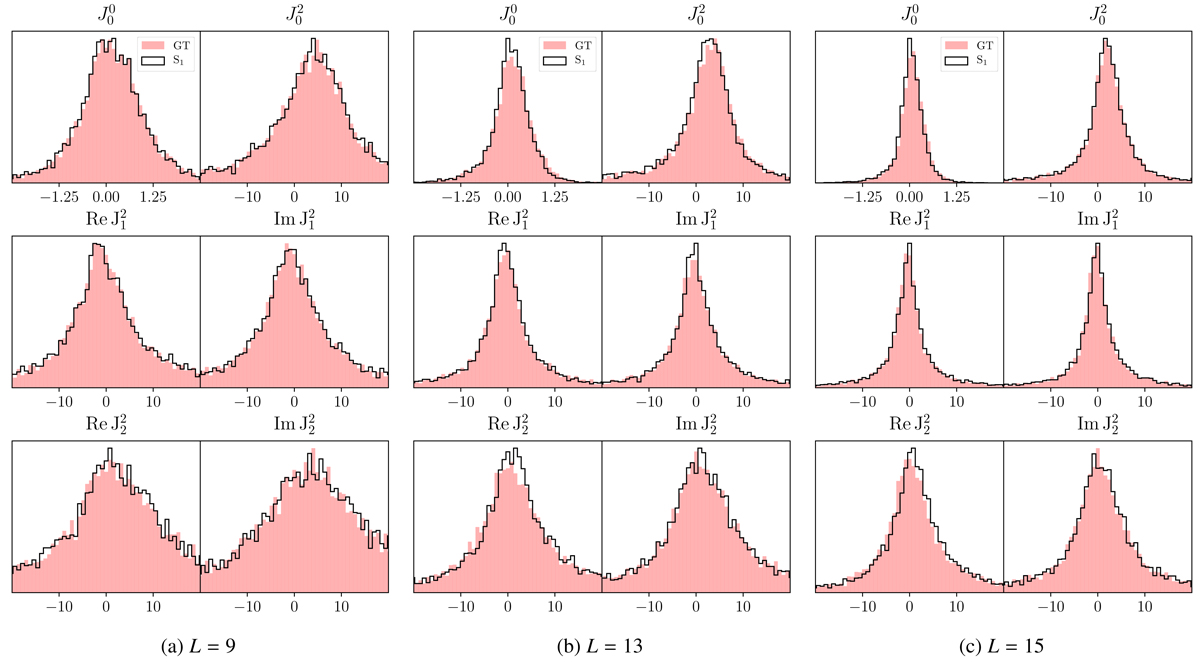
Histograms showing the relative errors in the percentage of the radiation field tensors, ![]() , with respect to the reference solution,
, with respect to the reference solution, ![]() , at the corrugated surface where the optical depth at the line centre is unity along the disc centre line of sight. The different panels show: (a) GT 3 × 3 and S1 with 8 rays per octant, (b) GT 4 × 4 and S1 with 14 rays per octant, and (c) GT 5 × 5 and S1 with 18 rays per octant.
, at the corrugated surface where the optical depth at the line centre is unity along the disc centre line of sight. The different panels show: (a) GT 3 × 3 and S1 with 8 rays per octant, (b) GT 4 × 4 and S1 with 14 rays per octant, and (c) GT 5 × 5 and S1 with 18 rays per octant.
Current usage metrics show cumulative count of Article Views (full-text article views including HTML views, PDF and ePub downloads, according to the available data) and Abstracts Views on Vision4Press platform.
Data correspond to usage on the plateform after 2015. The current usage metrics is available 48-96 hours after online publication and is updated daily on week days.
Initial download of the metrics may take a while.