Fig. 6.
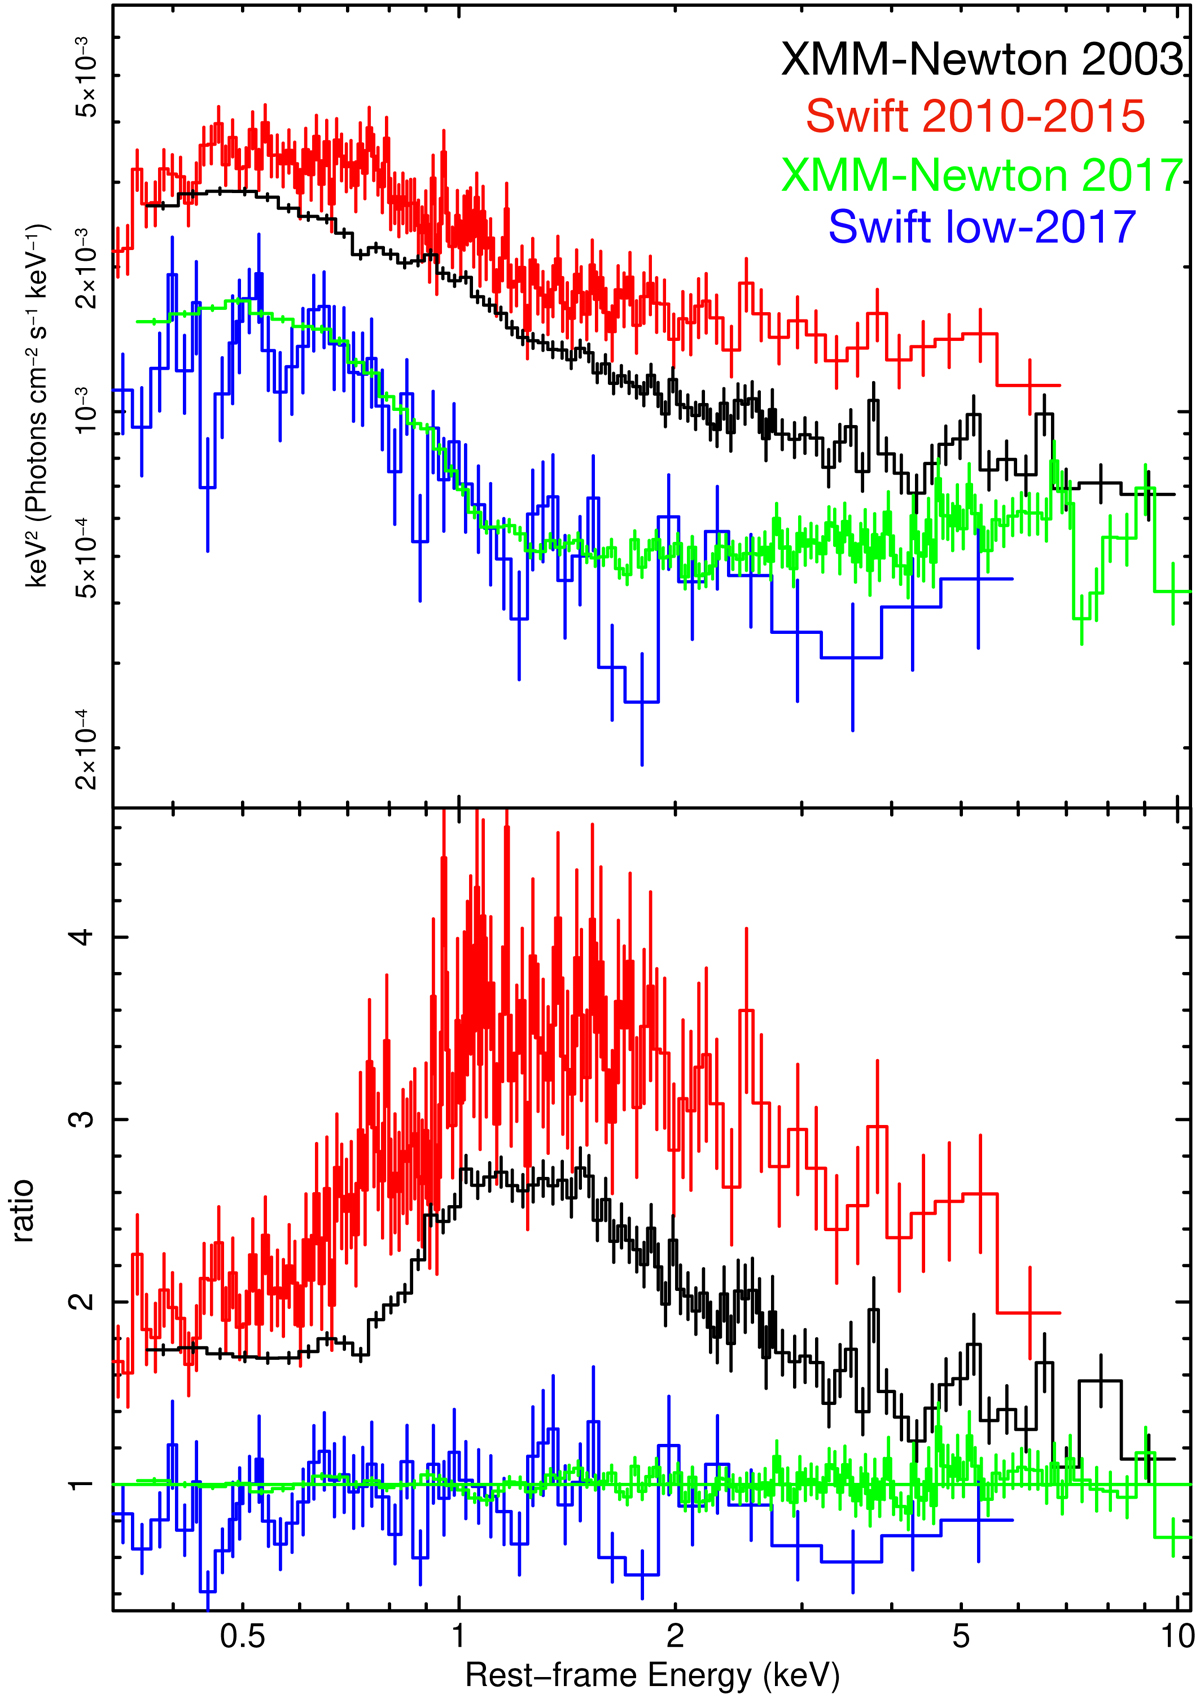
Top panel: unfolded XMM-Newton spectra of 2003 (in black) and 2017 (in green) compared to the stacked Swift/XRT spectra (in red and blue). In particular, the red spectrum is derived using all Swift/XRT datasets between 2010 and 2015, while the blue spectrum is derived using low flux state (log LX < 24.92) Swift/XRT spectra during 2017. Bottom panel: ratio of the data points of the XMM-Newton observations, as well as the stacked Swift/XRT observations, to a simple model describing the continuum of the 2017 XMM-Newton observation. The color scheme is the same as in the top panel.
Current usage metrics show cumulative count of Article Views (full-text article views including HTML views, PDF and ePub downloads, according to the available data) and Abstracts Views on Vision4Press platform.
Data correspond to usage on the plateform after 2015. The current usage metrics is available 48-96 hours after online publication and is updated daily on week days.
Initial download of the metrics may take a while.