Fig. 5.
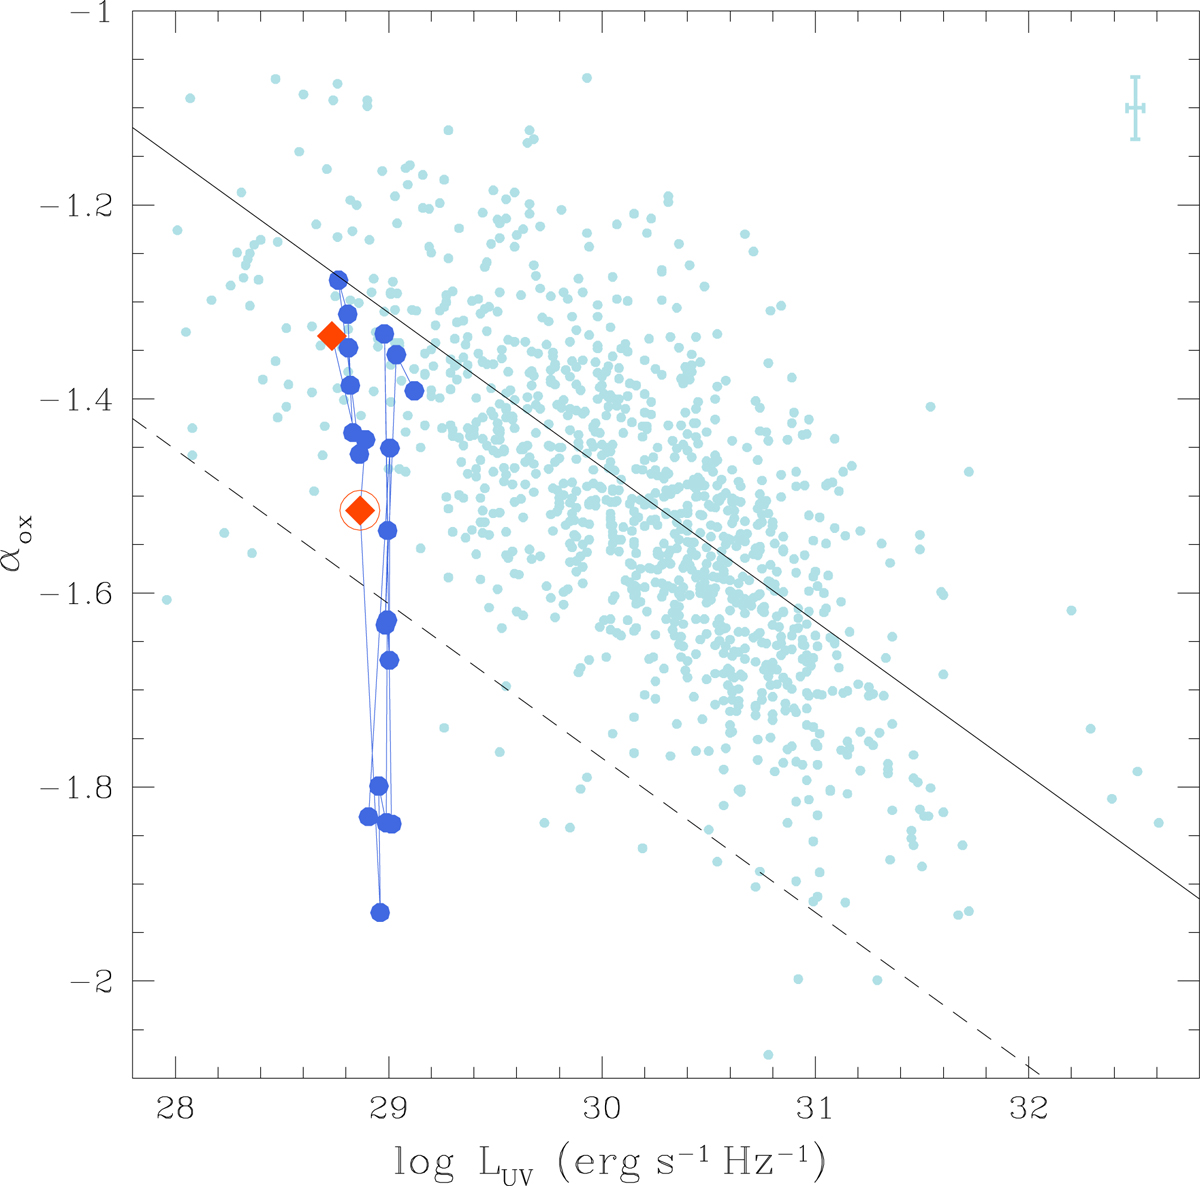
Track of PG 1448+273 in the log LUV − αox plane. The UV monochromatic luminosity is corrected for the host contribution, as described in the main text. Pale blue dots: sample from Chiaraluce et al. (2018). Average error bars are showed in the top right corner. The solid black line represents log LUV − αox linear relation as derived by the same authors. Dashed black line marks the reference value for X-ray weakness, as discussed by Pu et al. (2020). The color scheme is the same as in Fig. 4.
Current usage metrics show cumulative count of Article Views (full-text article views including HTML views, PDF and ePub downloads, according to the available data) and Abstracts Views on Vision4Press platform.
Data correspond to usage on the plateform after 2015. The current usage metrics is available 48-96 hours after online publication and is updated daily on week days.
Initial download of the metrics may take a while.