Free Access
Fig. 3.
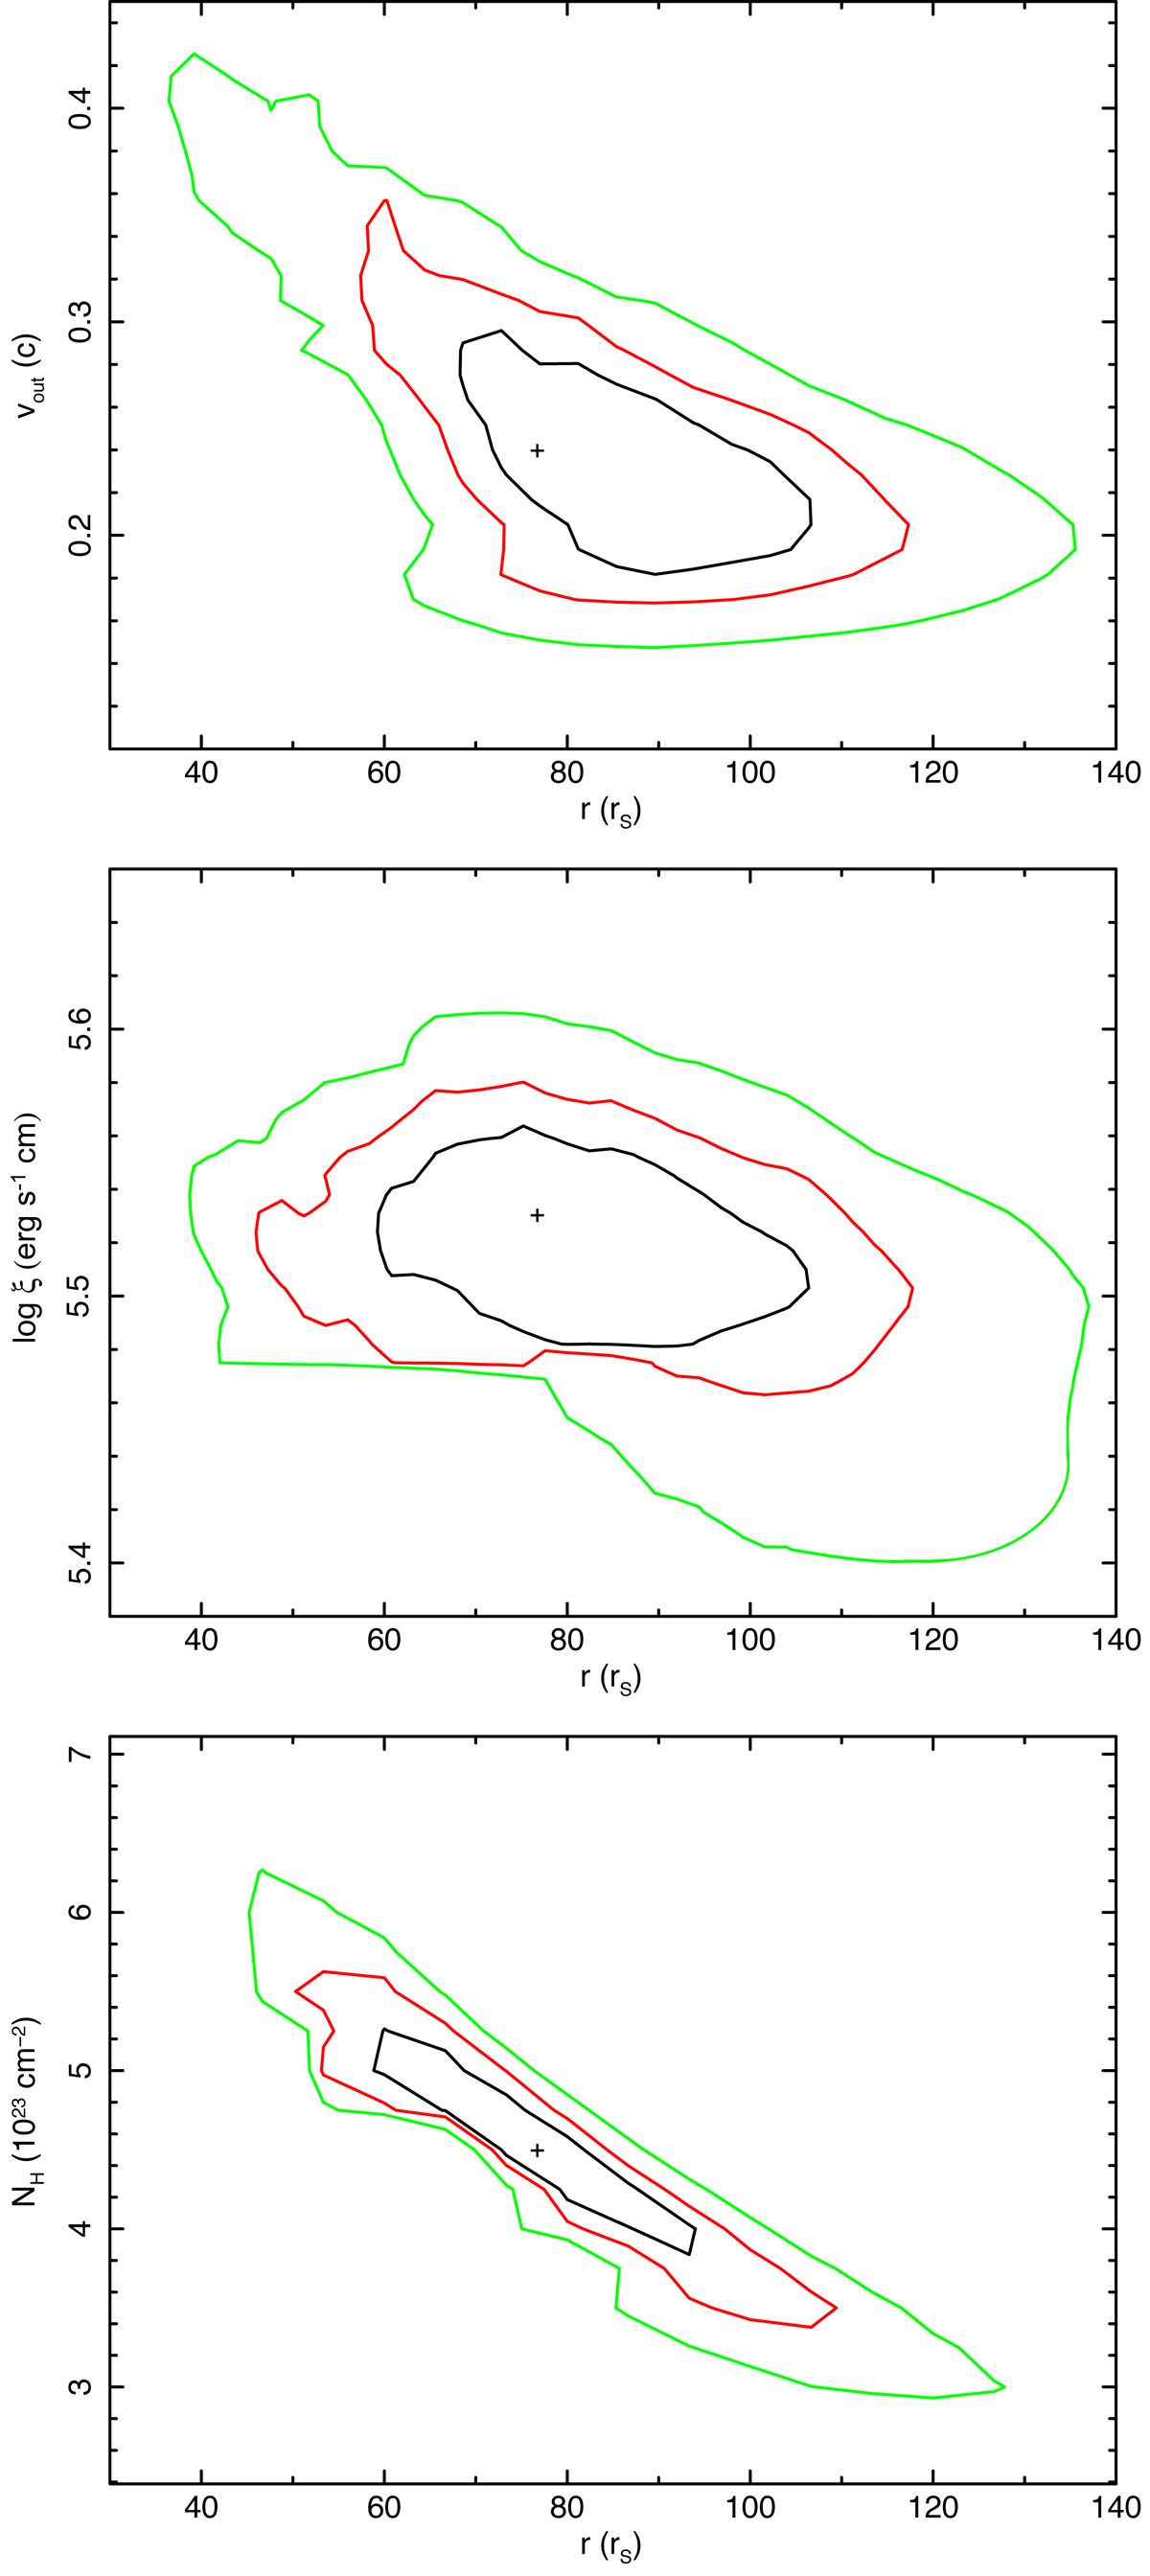
Contour plots of the launching radius vs. the outflow velocity (top panel), ionization parameter (middle panel) and wind column density (bottom panel). Black, red, and green lines correspond, respectively, to 68%, 90% and 99% confidence level.
Current usage metrics show cumulative count of Article Views (full-text article views including HTML views, PDF and ePub downloads, according to the available data) and Abstracts Views on Vision4Press platform.
Data correspond to usage on the plateform after 2015. The current usage metrics is available 48-96 hours after online publication and is updated daily on week days.
Initial download of the metrics may take a while.