Fig. 1.
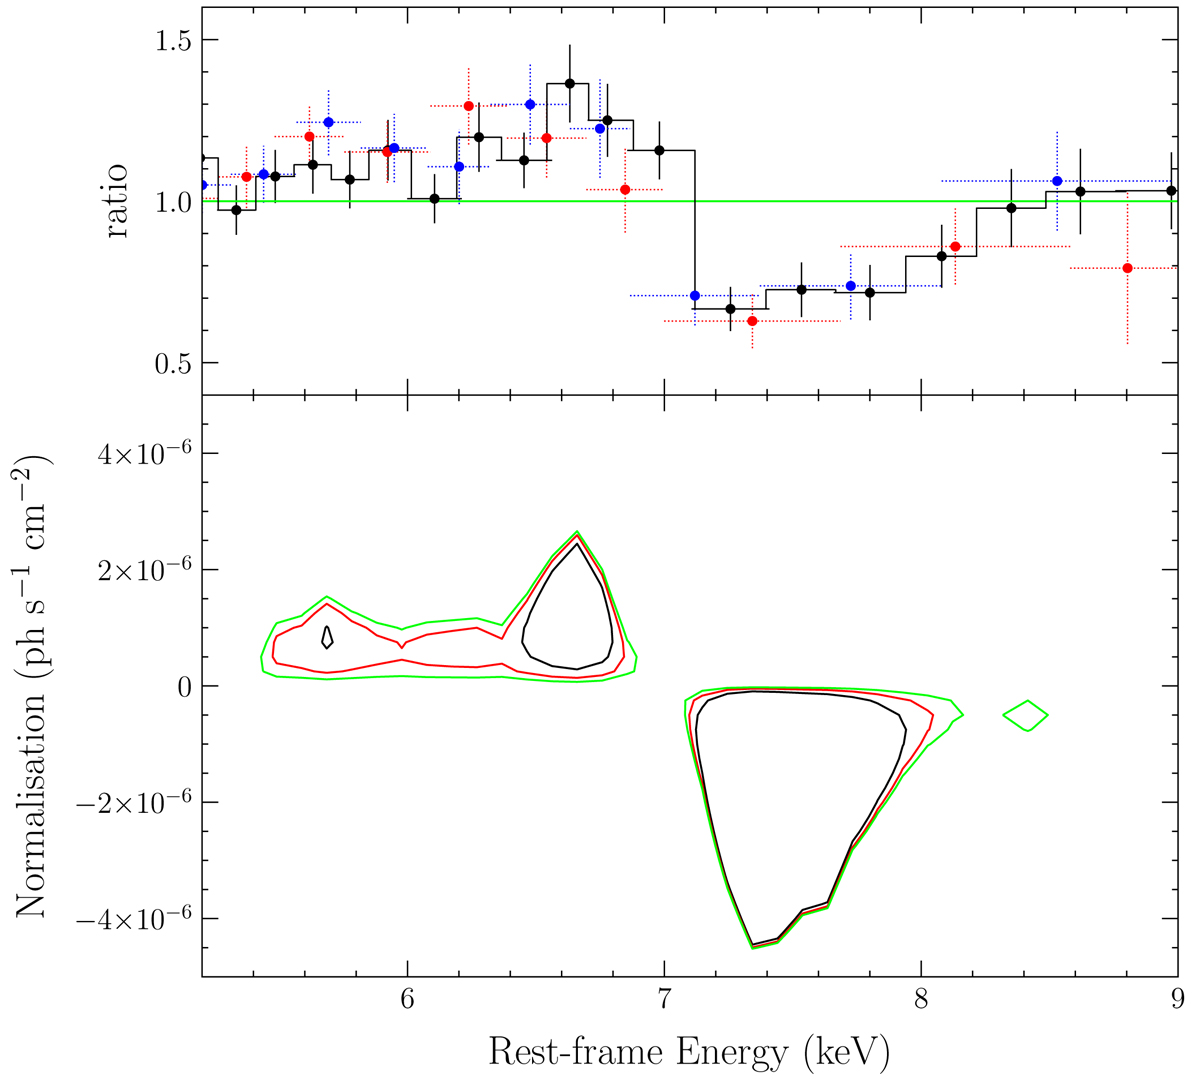
Top panel: ratio between the data points and the best-fit model. Data from EPIC-pn, MOS1, and MOS2 are shown in black, red, and blue, respectively. The model consists of a single absorbed power law describing the continuum, zoomed in on the E = 4 − 9 keV energy interval. Data are rebinned to a minimum S/N of 11σ and up to three counts only for plotting purposes. Bottom panel: contour plot describing the normalization vs. the rest-frame energy of a Gaussian line component in addition to the baseline model, consisting of a power law modified by Galactic absorption. Black, red, and green lines refer to the 68%, 90%, and 99% confidence level, respectively.
Current usage metrics show cumulative count of Article Views (full-text article views including HTML views, PDF and ePub downloads, according to the available data) and Abstracts Views on Vision4Press platform.
Data correspond to usage on the plateform after 2015. The current usage metrics is available 48-96 hours after online publication and is updated daily on week days.
Initial download of the metrics may take a while.