Fig. 9.
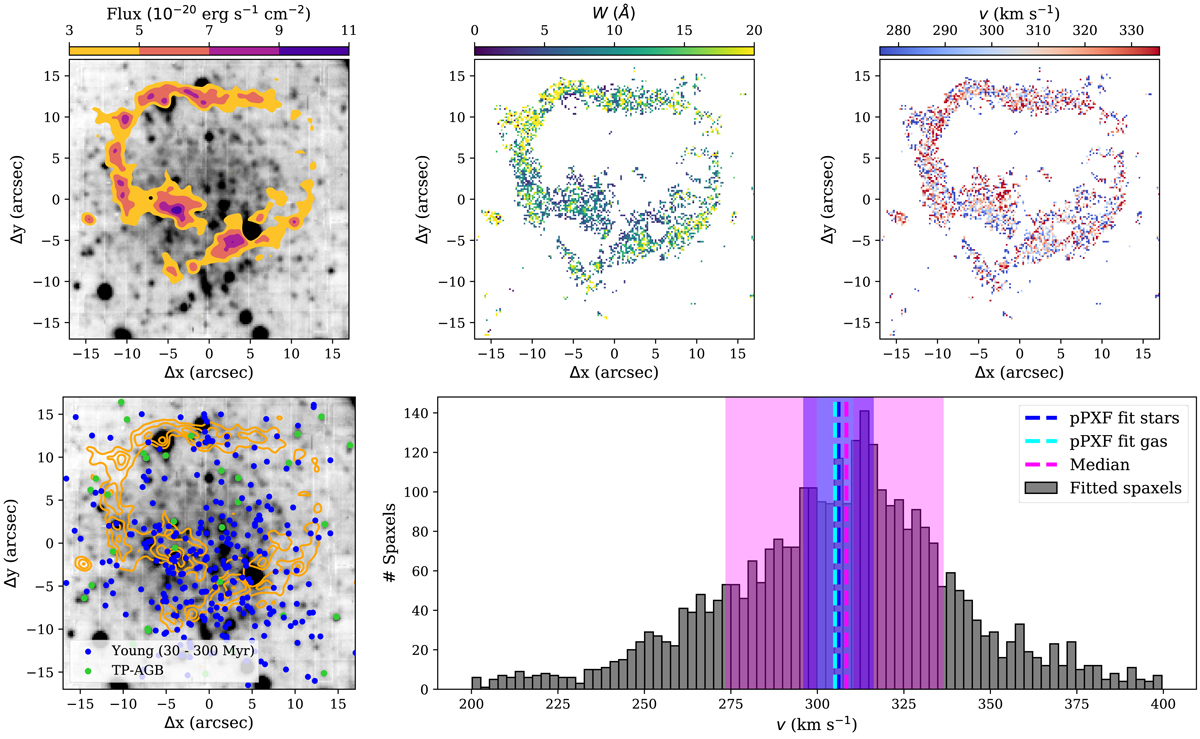
Dwarf galaxy KK 203 with its Hα emission. Top left: white-light image of KK 203 with Hα intensity contours. The contours refer to the residual Hα emission, created by subtracting a continuum image from a narrow-band Hα image obtained from the MUSE cube. Top-middle and top-right: equivalent width and line-of-sight velocity of the Hα emission, obtained from fitting spaxels with a Gaussian curve. Bottom-left: white light image with Hα contour and young supergiants (blue) and TP-AGB stars overplotted (see Fig. 11 for the selection). RGB stars are distributed randomly over the galaxy and are not shown here. Bottom-right: histogram of line-of-sight velocities. The median with 1σ uncertainties is highlighted in pink, light and dark blue refer to the results from the pPXF fit of the stellar and gas component to the integrated spectrum.
Current usage metrics show cumulative count of Article Views (full-text article views including HTML views, PDF and ePub downloads, according to the available data) and Abstracts Views on Vision4Press platform.
Data correspond to usage on the plateform after 2015. The current usage metrics is available 48-96 hours after online publication and is updated daily on week days.
Initial download of the metrics may take a while.