Fig. 8.
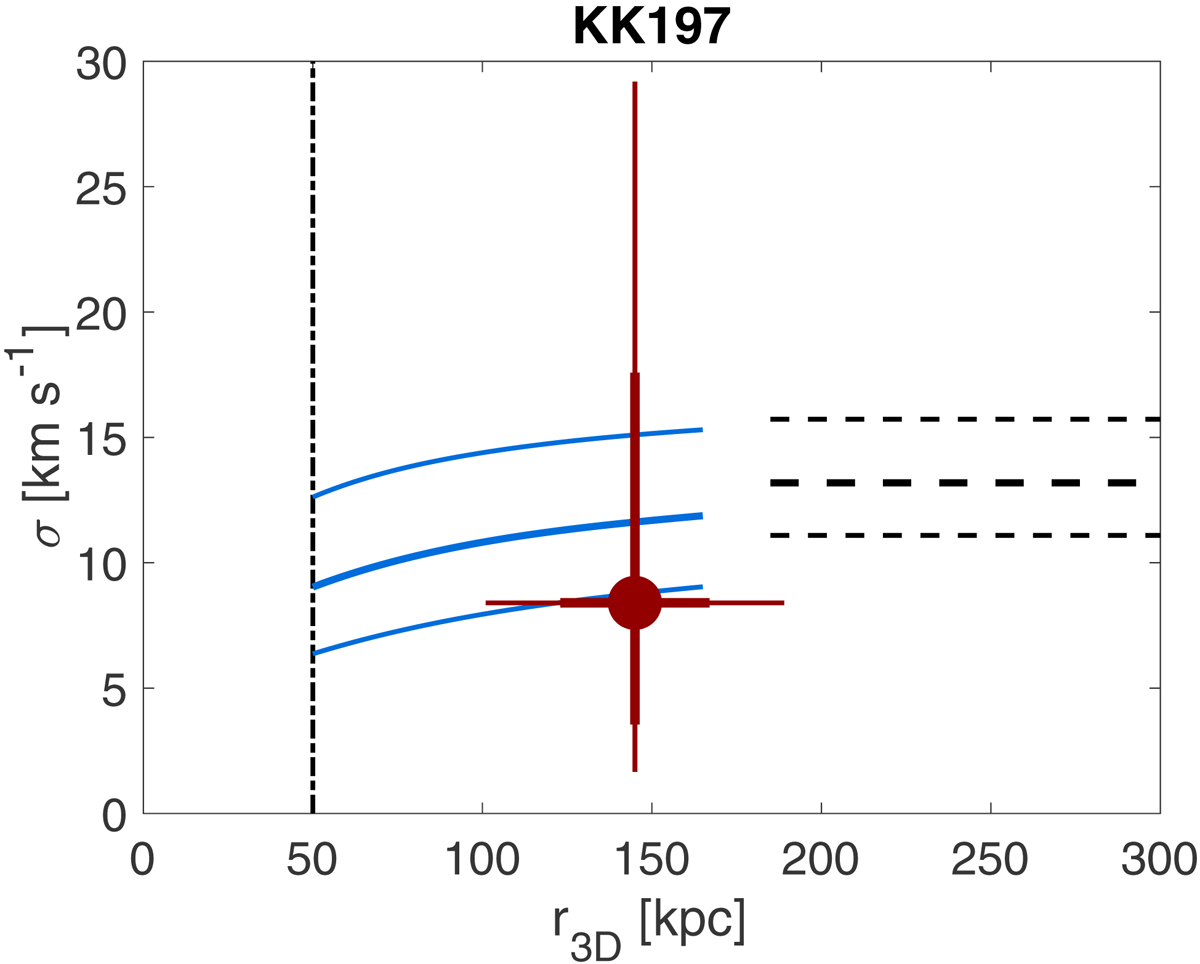
Predicted MOND velocity dispersion for KK 197 as a function of its 3D separation to Cen A. The horizontal dashed lines show the MOND prediction (and its 1σ uncertainty) for the isolated case, while blue lines correspond to the MOND prediction considering the EFE from Cen A. The red dot is the measured value considering the stellar clusters. The 1σ and 2σ uncertainties are represented by the thick and thin red lines.
Current usage metrics show cumulative count of Article Views (full-text article views including HTML views, PDF and ePub downloads, according to the available data) and Abstracts Views on Vision4Press platform.
Data correspond to usage on the plateform after 2015. The current usage metrics is available 48-96 hours after online publication and is updated daily on week days.
Initial download of the metrics may take a while.