Fig. 7.
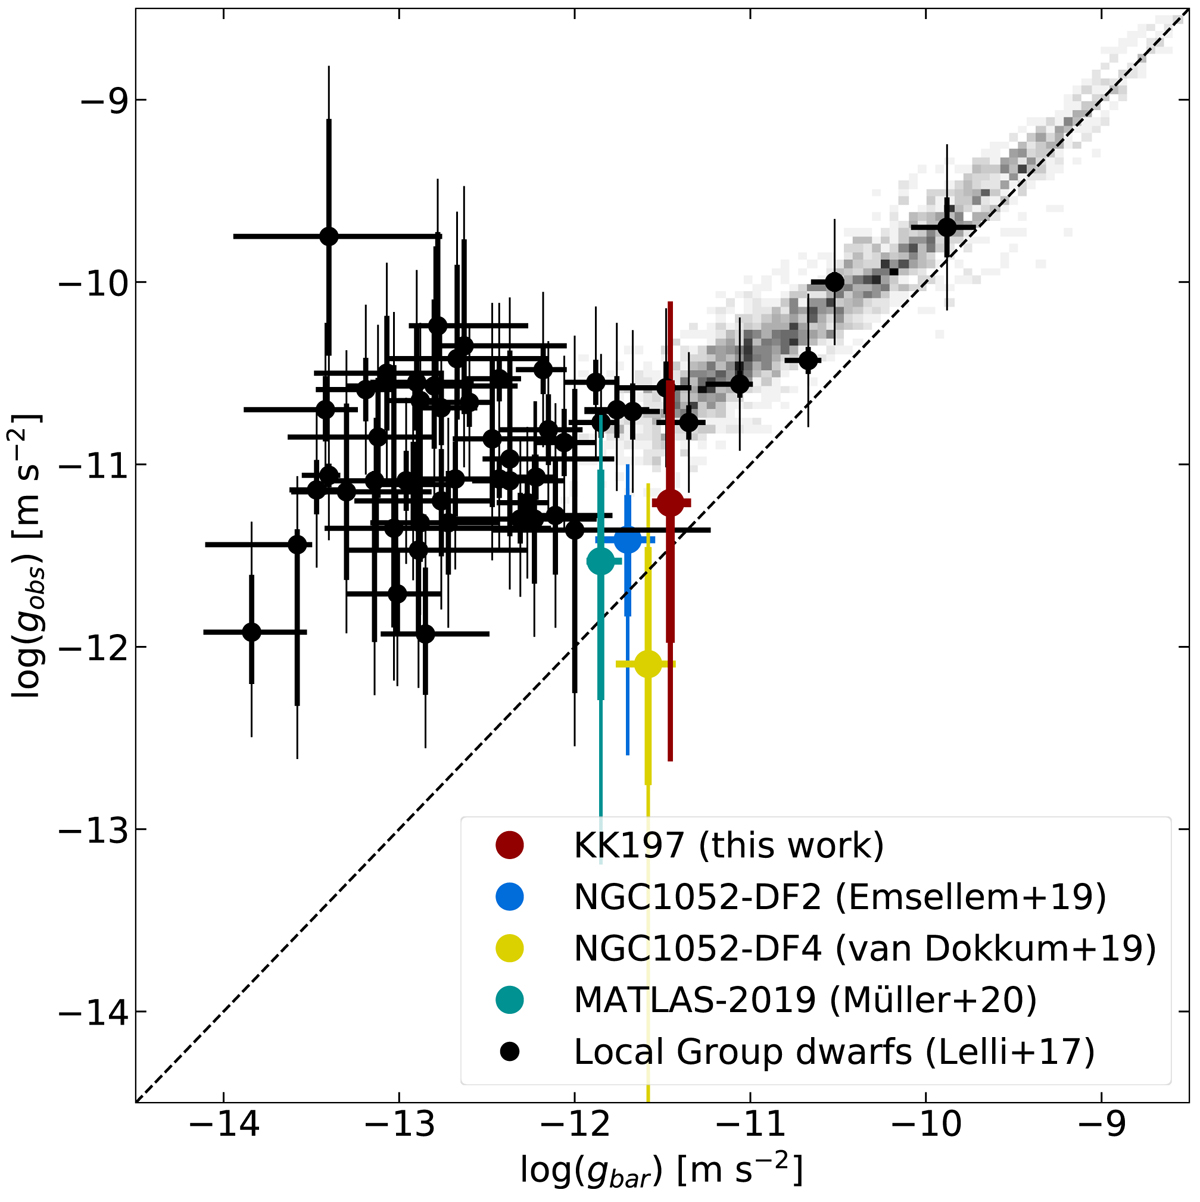
Radial acceleration relation of galaxies. The dashed line corresponds to unity, meaning that the baryonic acceleration (x-axis) is equal to the observed acceleration in the system (y-axis). The gray scale represents ∼2700 spatially resolved measurements in rotationally supported galaxies (spirals and dIrrs, see McGaugh et al. 2016). The black dots correspond to pressure-supported dwarf galaxies in the Local Group as compiled in Lelli et al. (2017) and come from different sources (e.g., Simon & Geha 2007; Mateo et al. 2008; Koch et al. 2009; Walker et al. 2009; Geha et al. 2010; Tollerud et al. 2012; Collins et al. 2013, 2015; Martin et al. 2014). The cyan dot represents MATLAS-2019 (Müller et al. 2020). The blue and yellow lines are two so-called ultra diffuse galaxies: NGC 1052-DF2 (Danieli et al. 2019) and NGC 1052-DF4 (van Dokkum et al. 2019). The red dot shows our new measurements for KK 197. The thick and thin lines are the 1 and 2σ uncertainties, respectively.
Current usage metrics show cumulative count of Article Views (full-text article views including HTML views, PDF and ePub downloads, according to the available data) and Abstracts Views on Vision4Press platform.
Data correspond to usage on the plateform after 2015. The current usage metrics is available 48-96 hours after online publication and is updated daily on week days.
Initial download of the metrics may take a while.