Fig. 6.
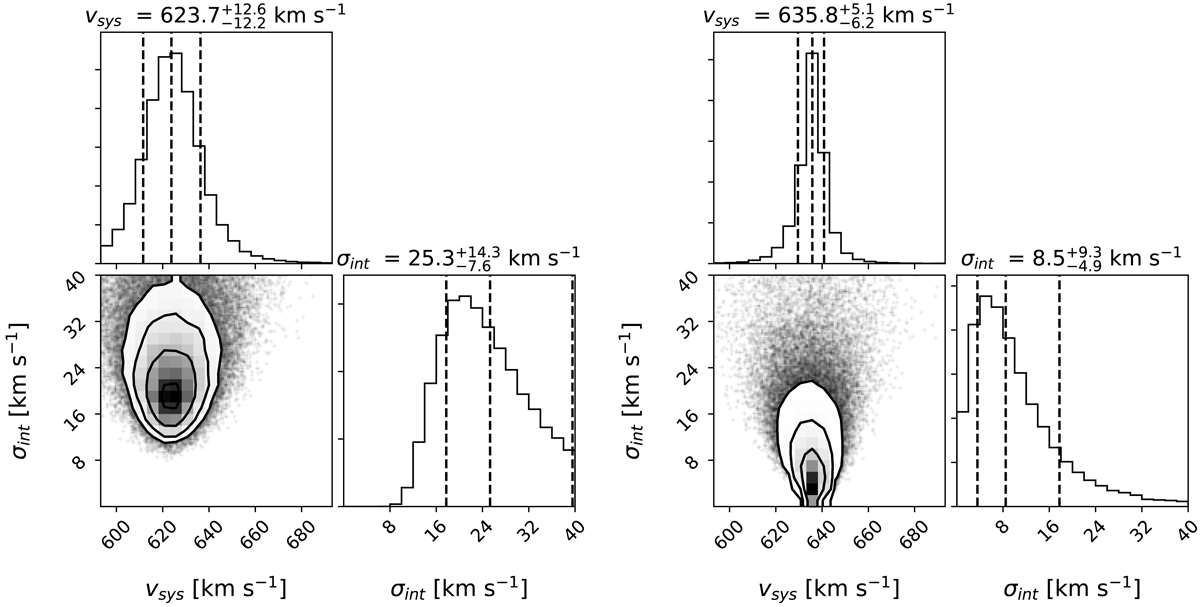
Posterior distribution from the MCMC analysis of the velocity dispersion of KK 197, as well as the systemic velocity of the tracers. Left is the estimation including the PN as tracer, right without including it. The three dashed lines indicate the 16, 50, and 84 percentiles, which correspond to the upper and lower uncertainty boundaries, and the best parameter estimation (i.e., the median).
Current usage metrics show cumulative count of Article Views (full-text article views including HTML views, PDF and ePub downloads, according to the available data) and Abstracts Views on Vision4Press platform.
Data correspond to usage on the plateform after 2015. The current usage metrics is available 48-96 hours after online publication and is updated daily on week days.
Initial download of the metrics may take a while.