Open Access
Fig. 5.
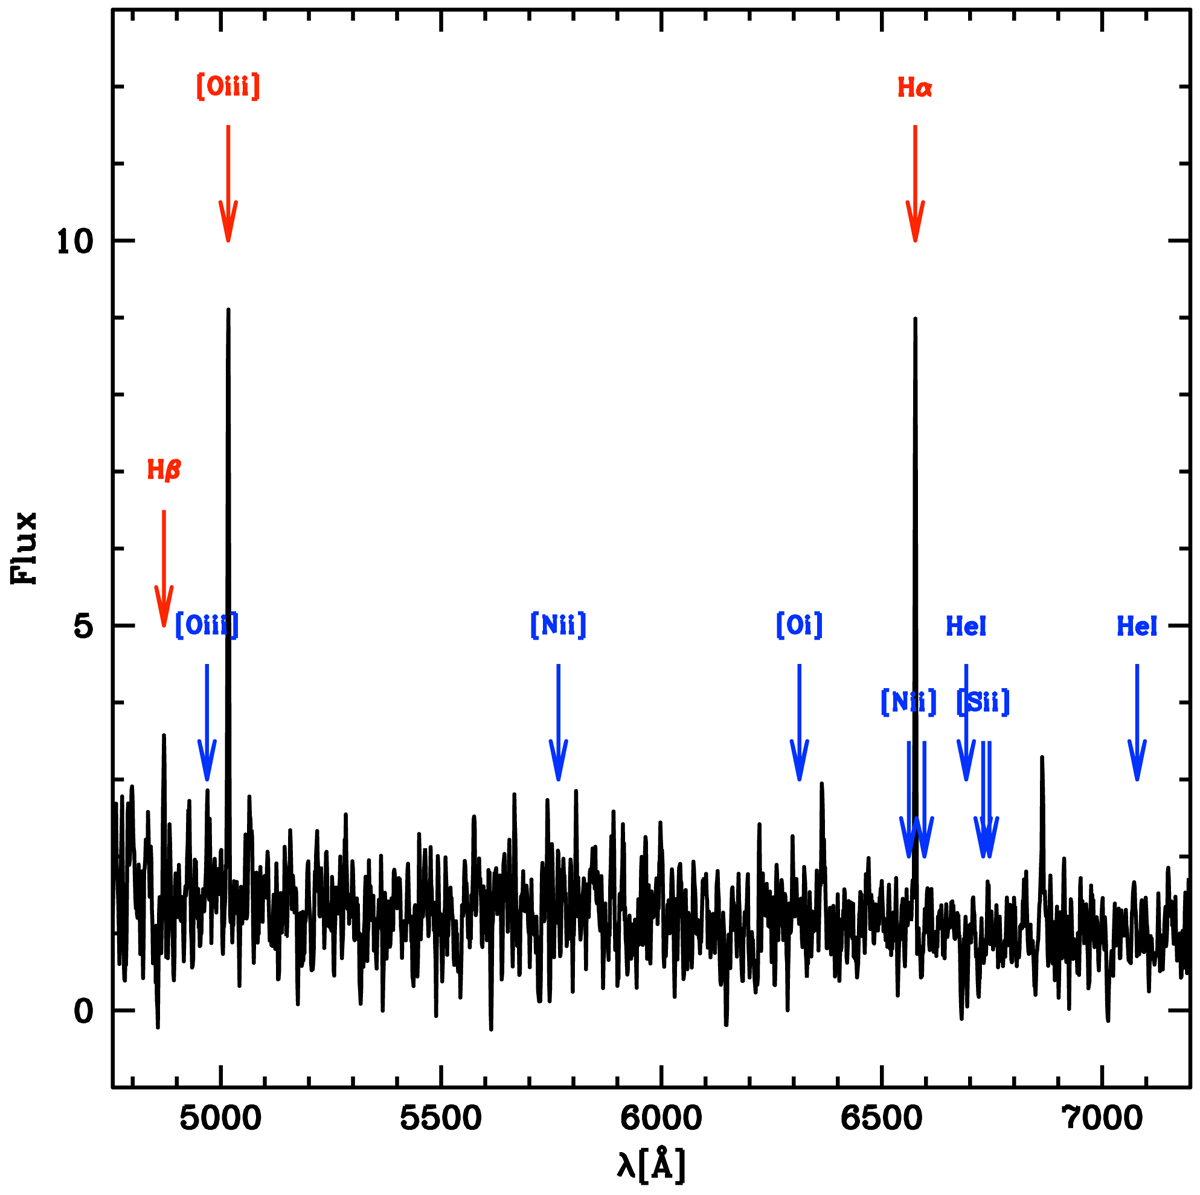
MUSE spectrum of the PN in KK 197. The red and blue arrows indicate typical emission lines of PNe of which only the strongest ones (Hα, 5007 Å [OIII]) and possibly Hβ are detected, marked in red. The spectra were slightly smoothed with a three-point boxcar filter.
Current usage metrics show cumulative count of Article Views (full-text article views including HTML views, PDF and ePub downloads, according to the available data) and Abstracts Views on Vision4Press platform.
Data correspond to usage on the plateform after 2015. The current usage metrics is available 48-96 hours after online publication and is updated daily on week days.
Initial download of the metrics may take a while.