Fig. 4.
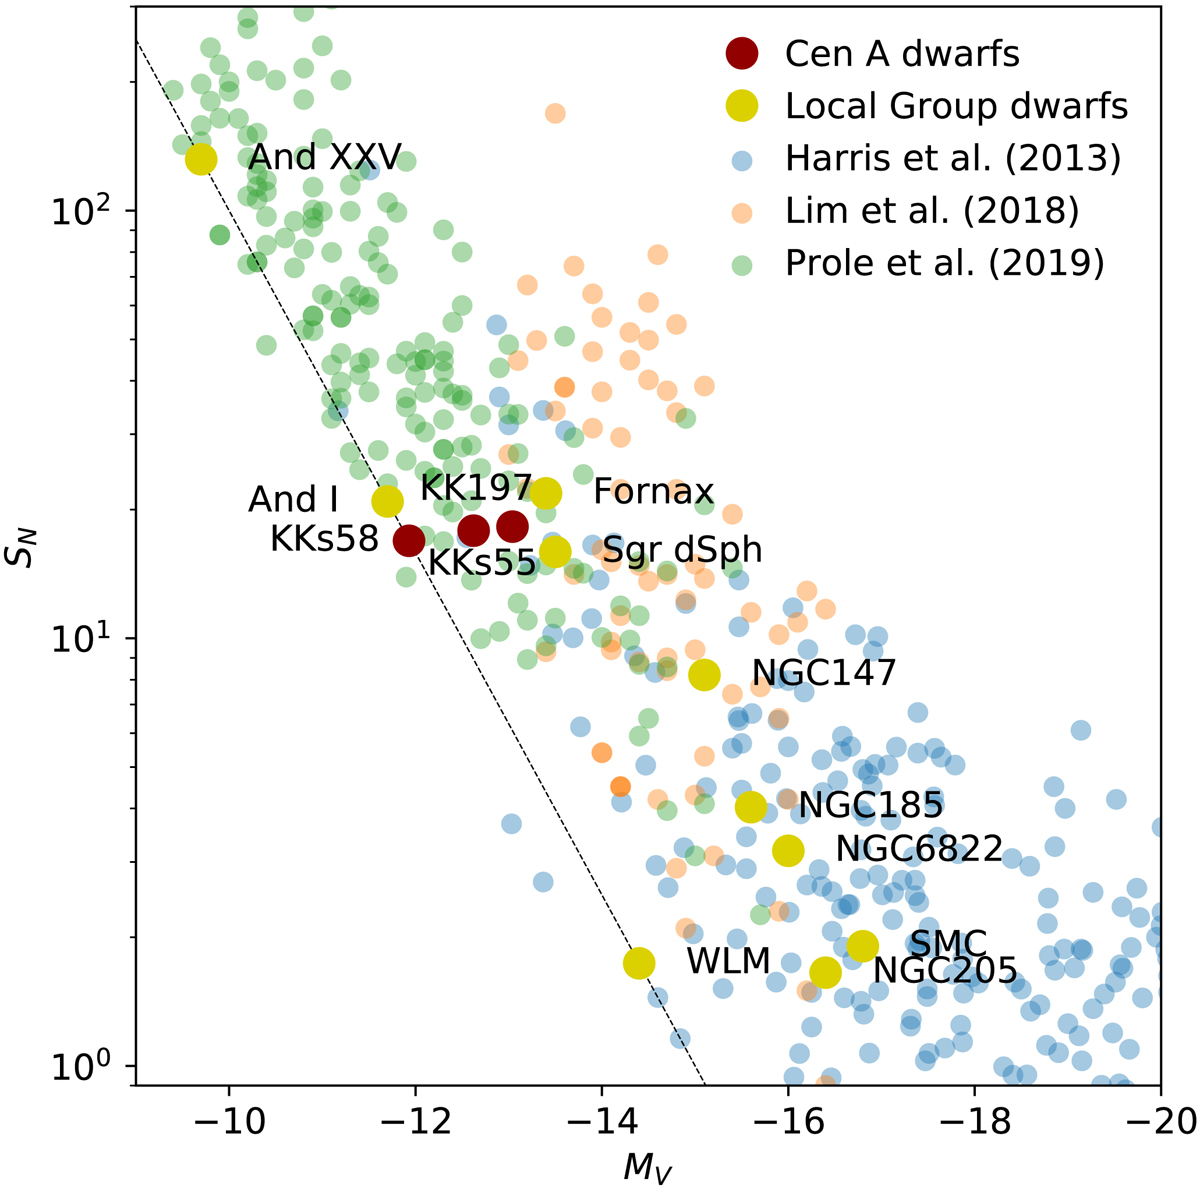
Specific frequency of the Cen A dwarfs (big red dots) compared to other galaxies. Blue dots are nearby galaxies from Harris et al. (2013), orange dots are Coma dwarf galaxies (Lim et al. 2018), and green dots are Fornax dwarf galaxies (Prole et al. 2019). The Local Group dwarfs are indicated with big yellow dots (Grebel 2016; Cusano et al. 2016; Caldwell et al. 2017). The dashed line indicates the specific frequency of an object with one GC. The specific frequencies for the Coma and Fornax dwarfs were estimated on a statistical basis, and often they are consistent with zero within the uncertainties.
Current usage metrics show cumulative count of Article Views (full-text article views including HTML views, PDF and ePub downloads, according to the available data) and Abstracts Views on Vision4Press platform.
Data correspond to usage on the plateform after 2015. The current usage metrics is available 48-96 hours after online publication and is updated daily on week days.
Initial download of the metrics may take a while.