Fig. 1.
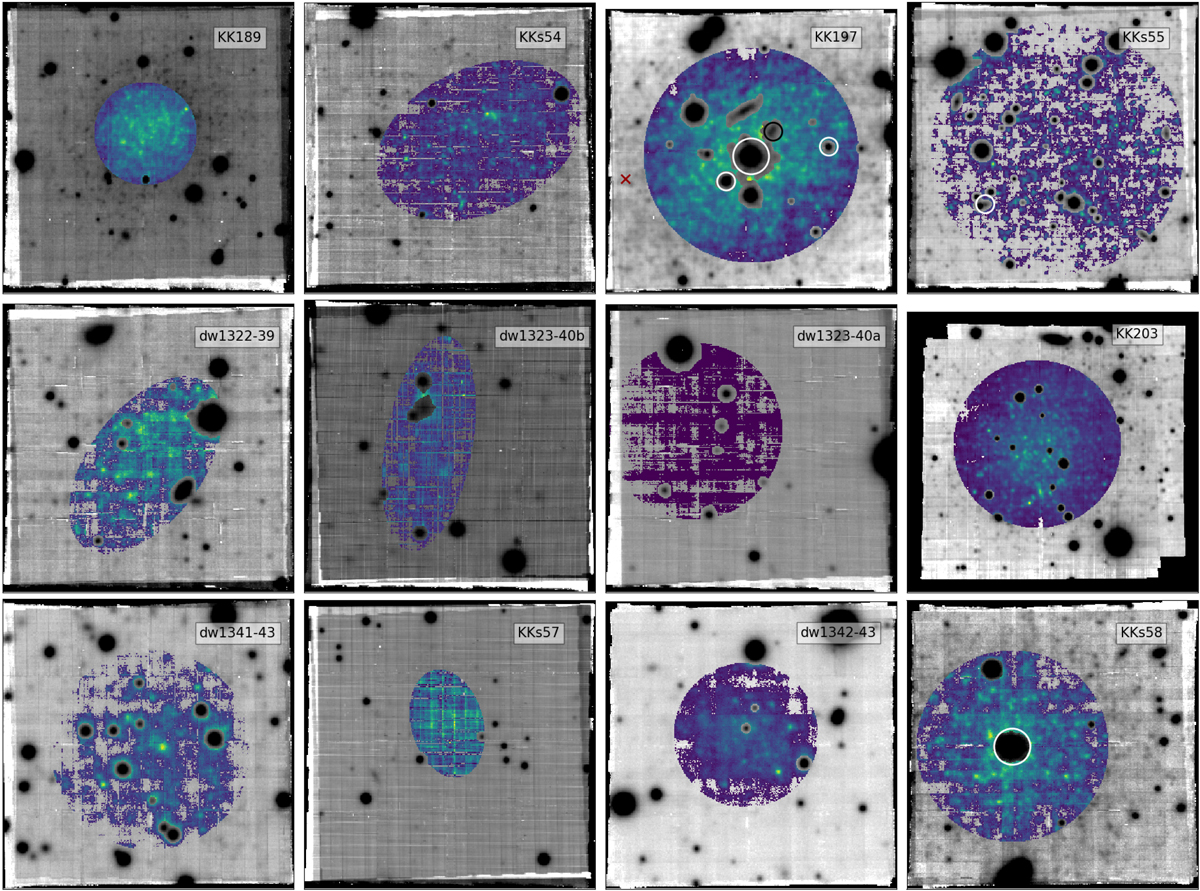
Collapsed, white-light images of the dwarf galaxies confirmed to be Cen A group members. The regions where we extracted the spectra are indicated in color. The NSC are indicated with the large white circles, the GCs as small white circles, the stellar association as small black circle, and the position of the PN is marked with a red cross. The images show the entire MUSE FOV – 1′ per side – which corresponds to 1.1 kpc at a mean distance of the Cen A group (3.8 Mpc), and are oriented with north up and east to the left.
Current usage metrics show cumulative count of Article Views (full-text article views including HTML views, PDF and ePub downloads, according to the available data) and Abstracts Views on Vision4Press platform.
Data correspond to usage on the plateform after 2015. The current usage metrics is available 48-96 hours after online publication and is updated daily on week days.
Initial download of the metrics may take a while.