Fig. 5
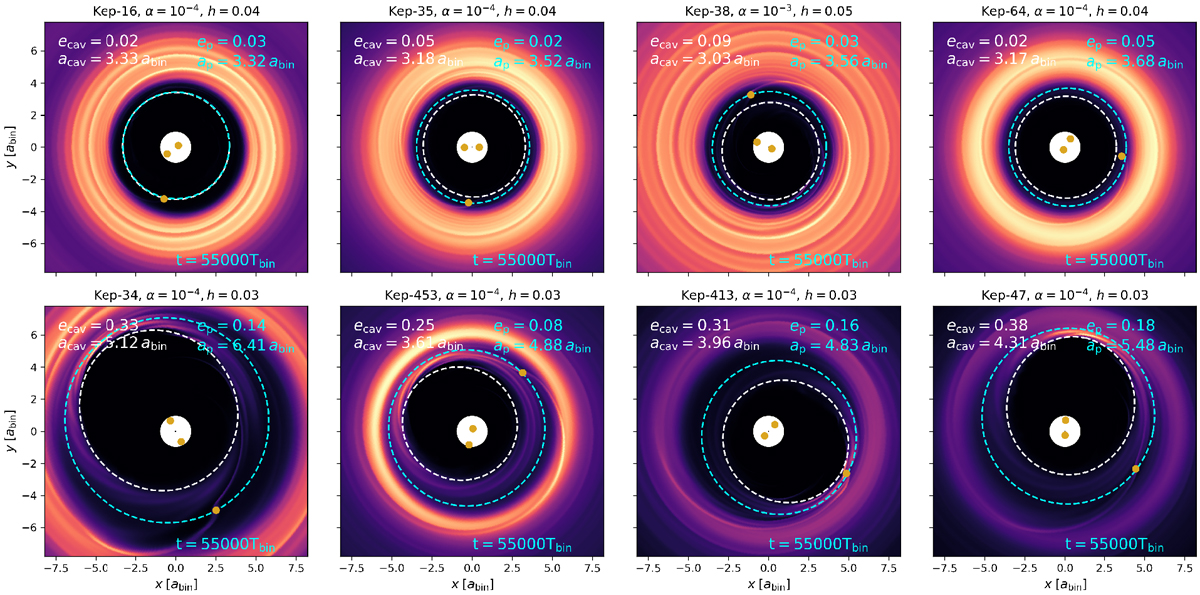
Discs and planets of eight of the considered Kepler systems listed in Table 1 and shown in Fig. 3, here shown with the embedded planets. The quoted times are measured after insertion of the planets. The chosen aspect ratio, h, and viscosity, α, correspond to those models that most successfully could reproduce the observed planet orbits (see Table 2 below). The white dashed line marks the inner cavity edge and the light blue line the planet orbit. Top row: planets that correspond to our success criteria of reaching the observed orbit by ± 0.1aobs, while lower row: systems that did not reach the observed orbit, due to their eccentric discs.
Current usage metrics show cumulative count of Article Views (full-text article views including HTML views, PDF and ePub downloads, according to the available data) and Abstracts Views on Vision4Press platform.
Data correspond to usage on the plateform after 2015. The current usage metrics is available 48-96 hours after online publication and is updated daily on week days.
Initial download of the metrics may take a while.