Fig. 4.
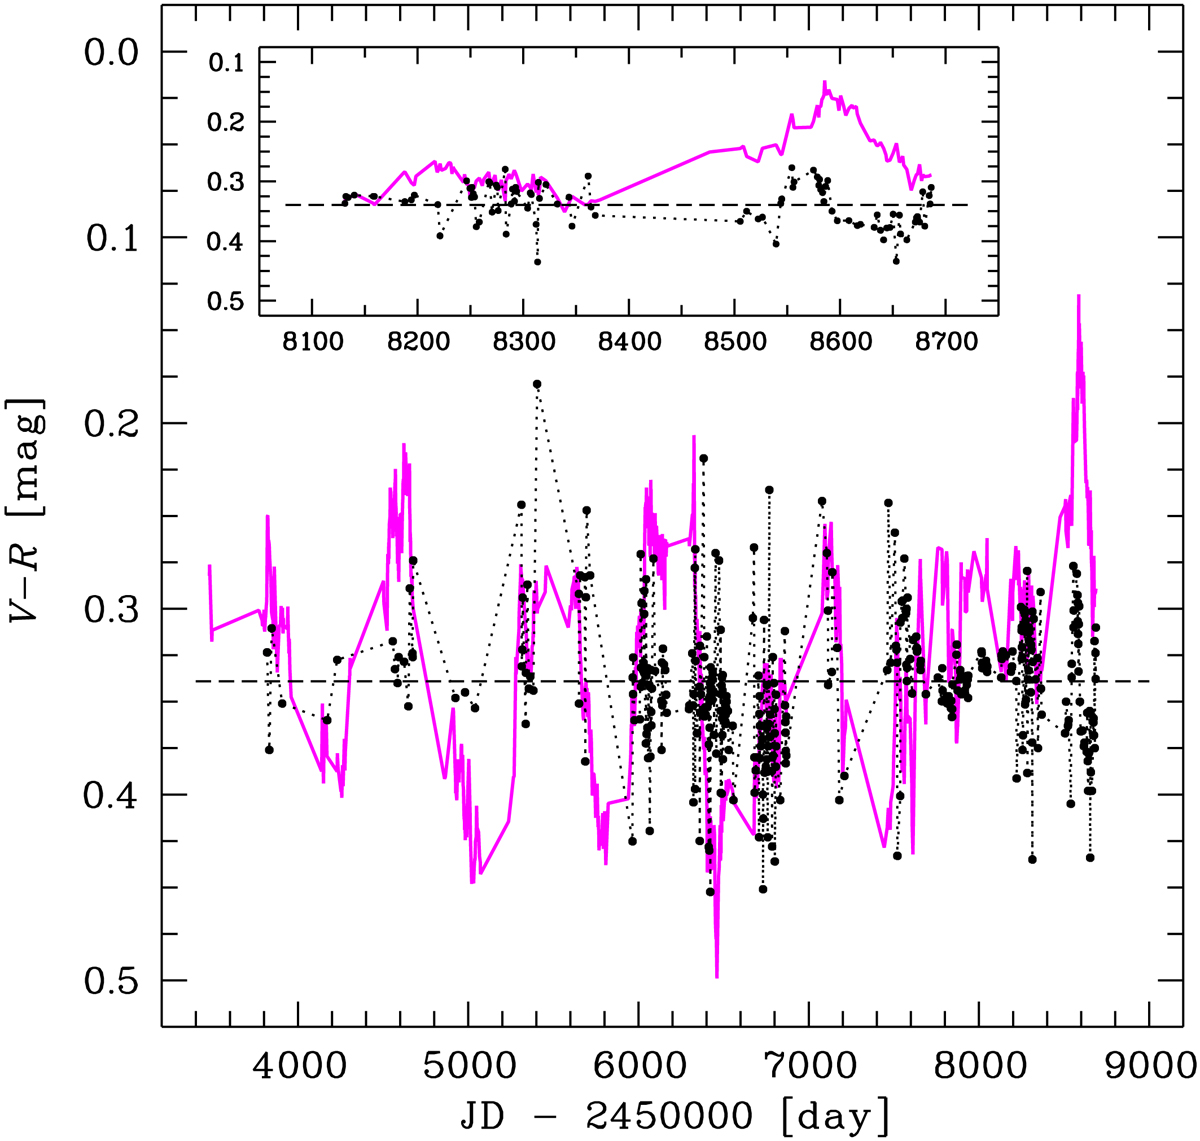
Temporal evolution of the V − R colour index (black dots). The scaled R-band LC is overplotted for comparison (magenta line, the flux increases along +y axis). The horizontal dashed line marks the weighted mean V − R value of (0.339 ± 0.002) mag with a weighted standard deviation of 0.030 mag about the weighted mean. The insert shows the 2019 flare in details – the maximum of the spectral hardness (the minimum of V − R) precedes the flare by about 10 days (see Sect. 3.5 for details).
Current usage metrics show cumulative count of Article Views (full-text article views including HTML views, PDF and ePub downloads, according to the available data) and Abstracts Views on Vision4Press platform.
Data correspond to usage on the plateform after 2015. The current usage metrics is available 48-96 hours after online publication and is updated daily on week days.
Initial download of the metrics may take a while.