Fig. 3.
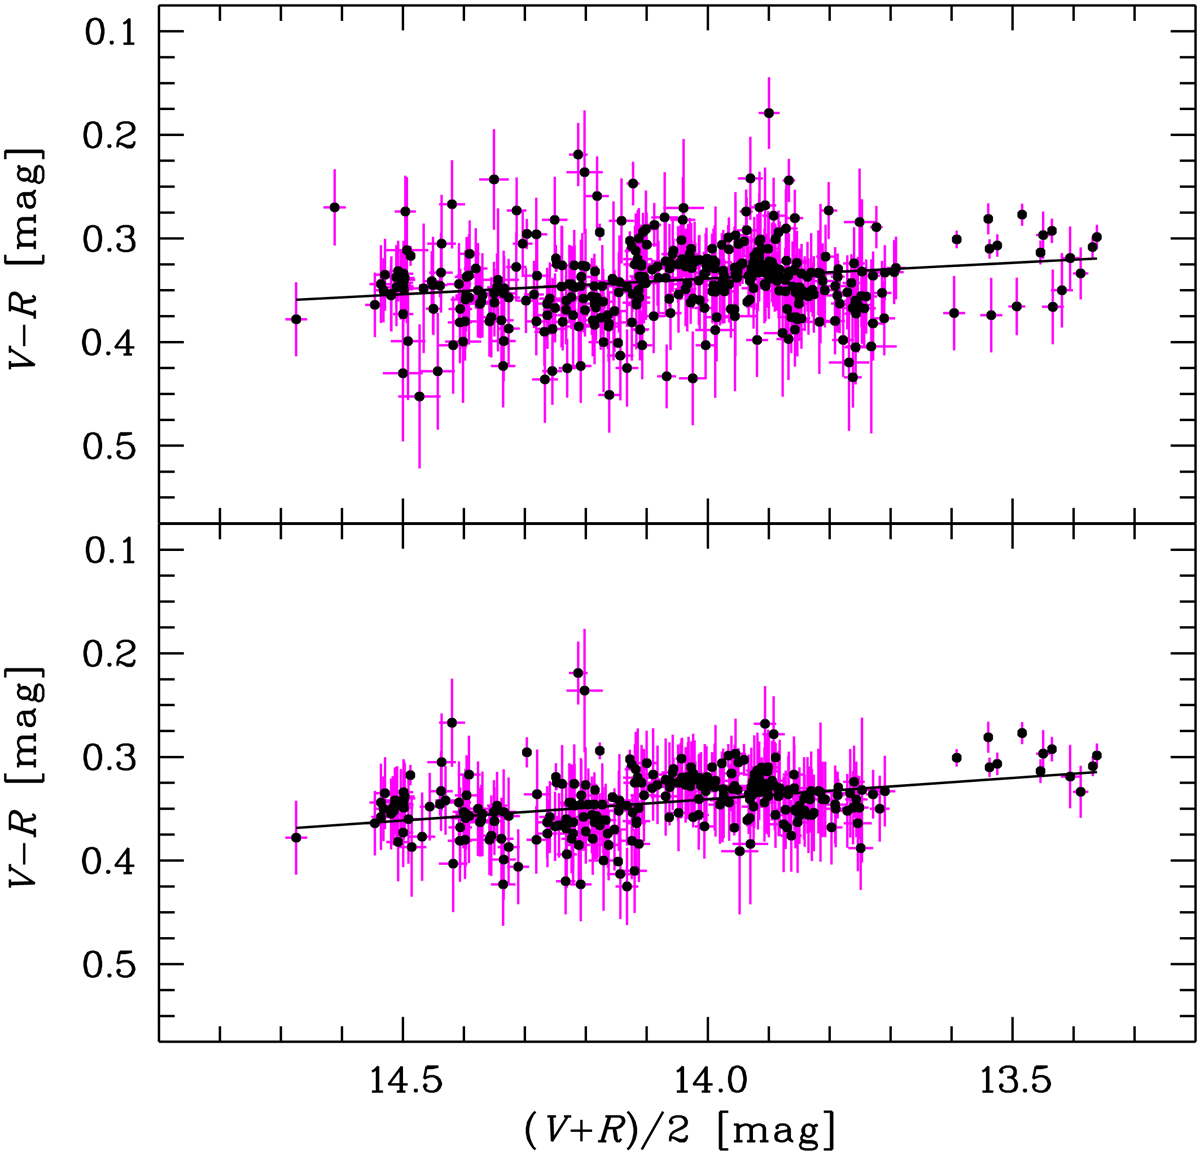
Colour-magnitude diagram for the historical data set (upper panel, 373 data points plotted) and for our, Steward, and Kanata data sets (lower panel, 274 data points plotted). The linear least-squares fits are overplotted. For both panels the median uncertainties of the magnitudes and colour indices are 0.018 mag and 0.036 mag, respectively.
Current usage metrics show cumulative count of Article Views (full-text article views including HTML views, PDF and ePub downloads, according to the available data) and Abstracts Views on Vision4Press platform.
Data correspond to usage on the plateform after 2015. The current usage metrics is available 48-96 hours after online publication and is updated daily on week days.
Initial download of the metrics may take a while.