Free Access
Fig. B.1.
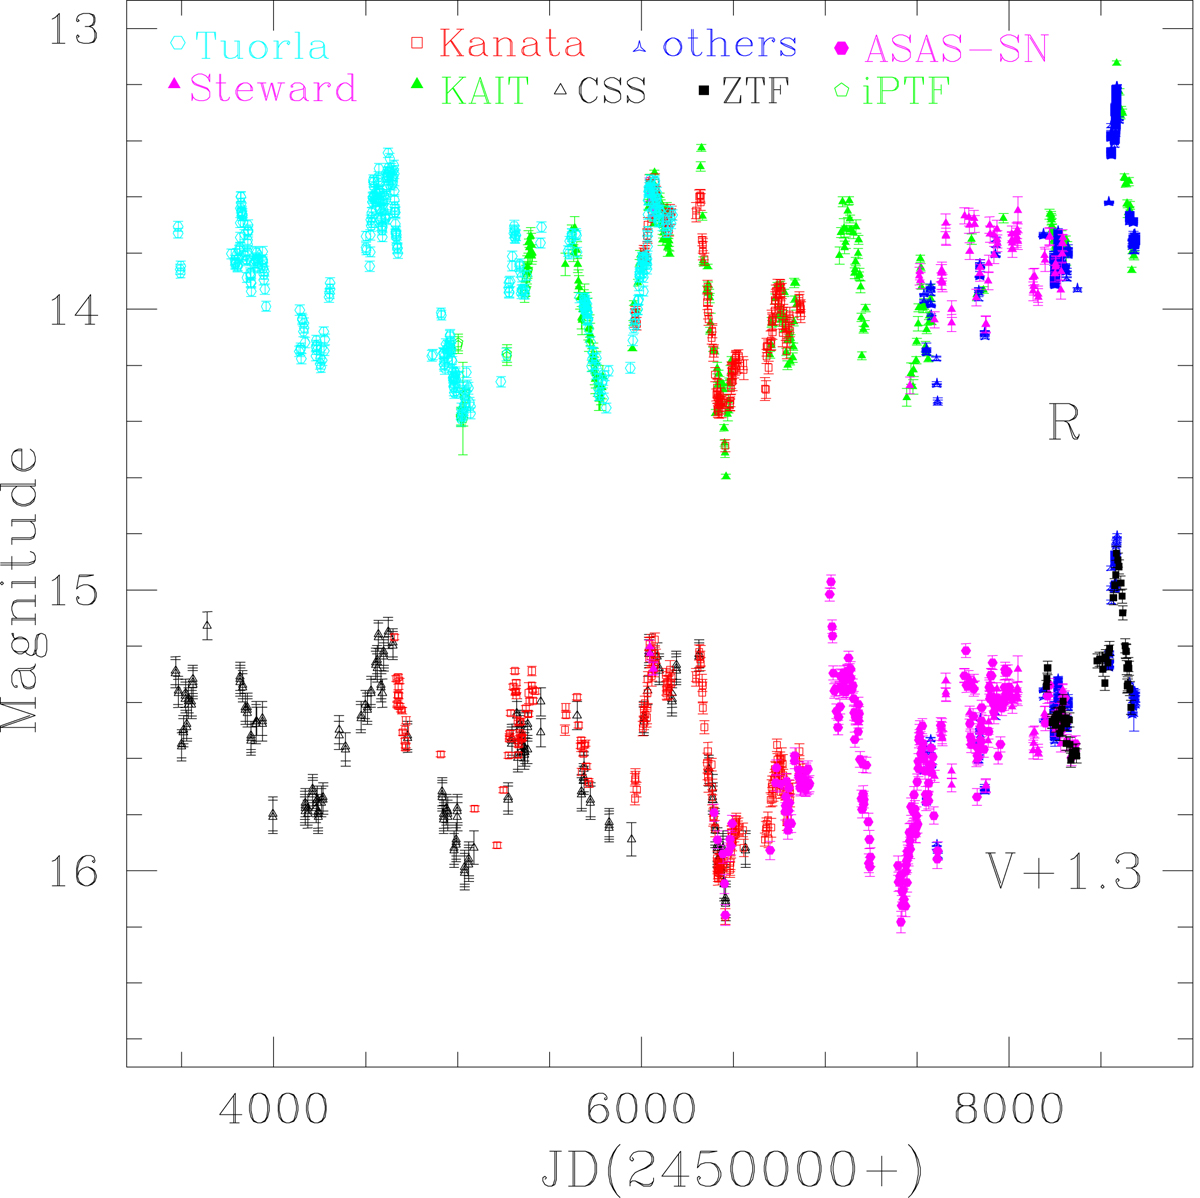
Long-term VR-band LCs for PG 1553+113. Different colours and symbols denote data from different observatories and telescopes as indicated in the plot. In particular, “others” denote the data collected by the nine telescopes mentioned in Sect. 2 The data plotted are not nightly binned.
Current usage metrics show cumulative count of Article Views (full-text article views including HTML views, PDF and ePub downloads, according to the available data) and Abstracts Views on Vision4Press platform.
Data correspond to usage on the plateform after 2015. The current usage metrics is available 48-96 hours after online publication and is updated daily on week days.
Initial download of the metrics may take a while.