Free Access
Fig. A.1.
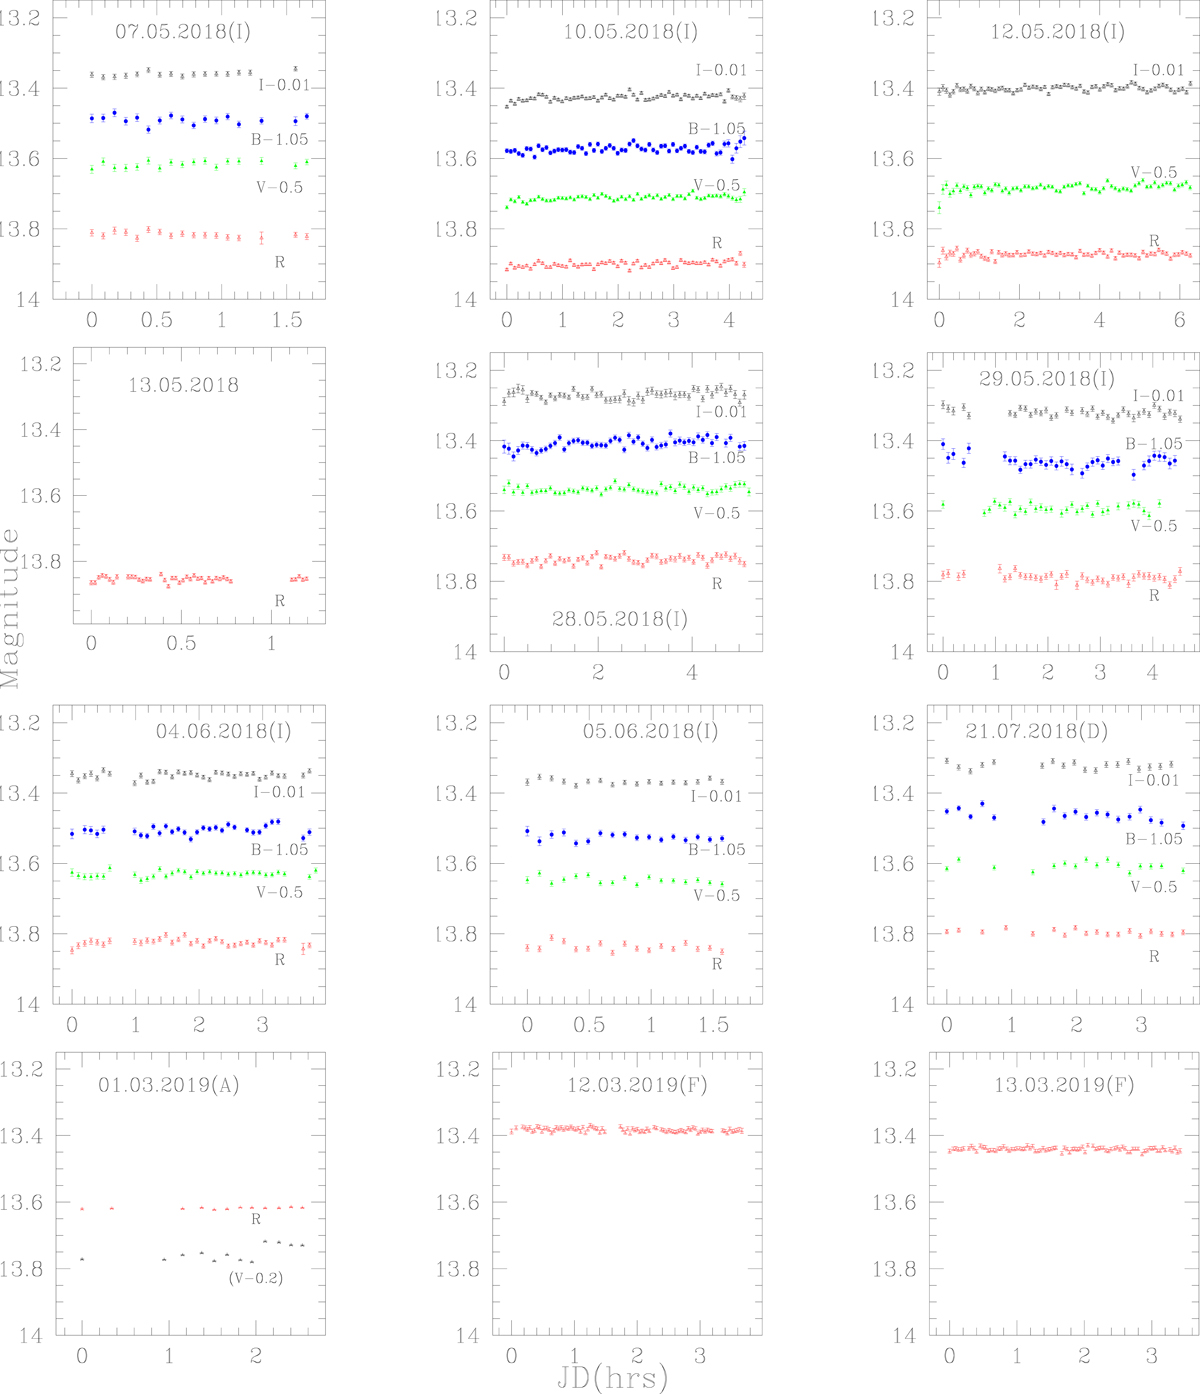
Intra-night LCs for PG 1553+113: blue denotes B-band, green – V-band, red – R-band, and black – I-band. In each plot the x-axis is the duration of the INM in hours. Date of observation and the telescope used are indicated in each plot.
Current usage metrics show cumulative count of Article Views (full-text article views including HTML views, PDF and ePub downloads, according to the available data) and Abstracts Views on Vision4Press platform.
Data correspond to usage on the plateform after 2015. The current usage metrics is available 48-96 hours after online publication and is updated daily on week days.
Initial download of the metrics may take a while.