Free Access
Fig. 16.
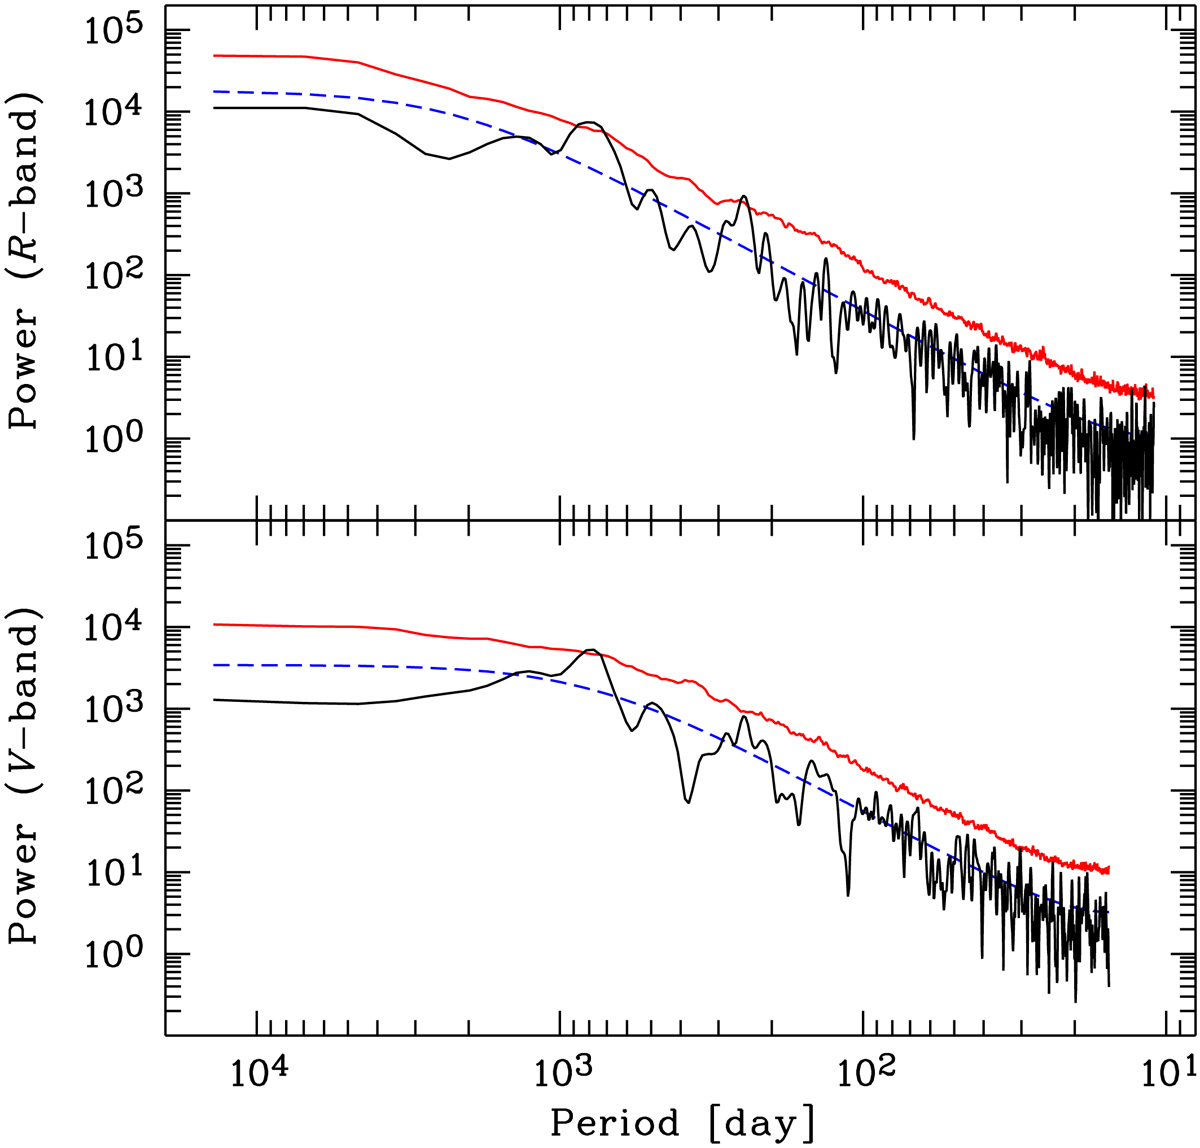
Output from the REDFIT programme. The black line shows the bias-corrected power spectrum, the blue dashed line marks the theoretical red noise spectrum and the red line marks the 99% local significance level derived by means of Monte Carlo simulations.
Current usage metrics show cumulative count of Article Views (full-text article views including HTML views, PDF and ePub downloads, according to the available data) and Abstracts Views on Vision4Press platform.
Data correspond to usage on the plateform after 2015. The current usage metrics is available 48-96 hours after online publication and is updated daily on week days.
Initial download of the metrics may take a while.