Fig. 1.
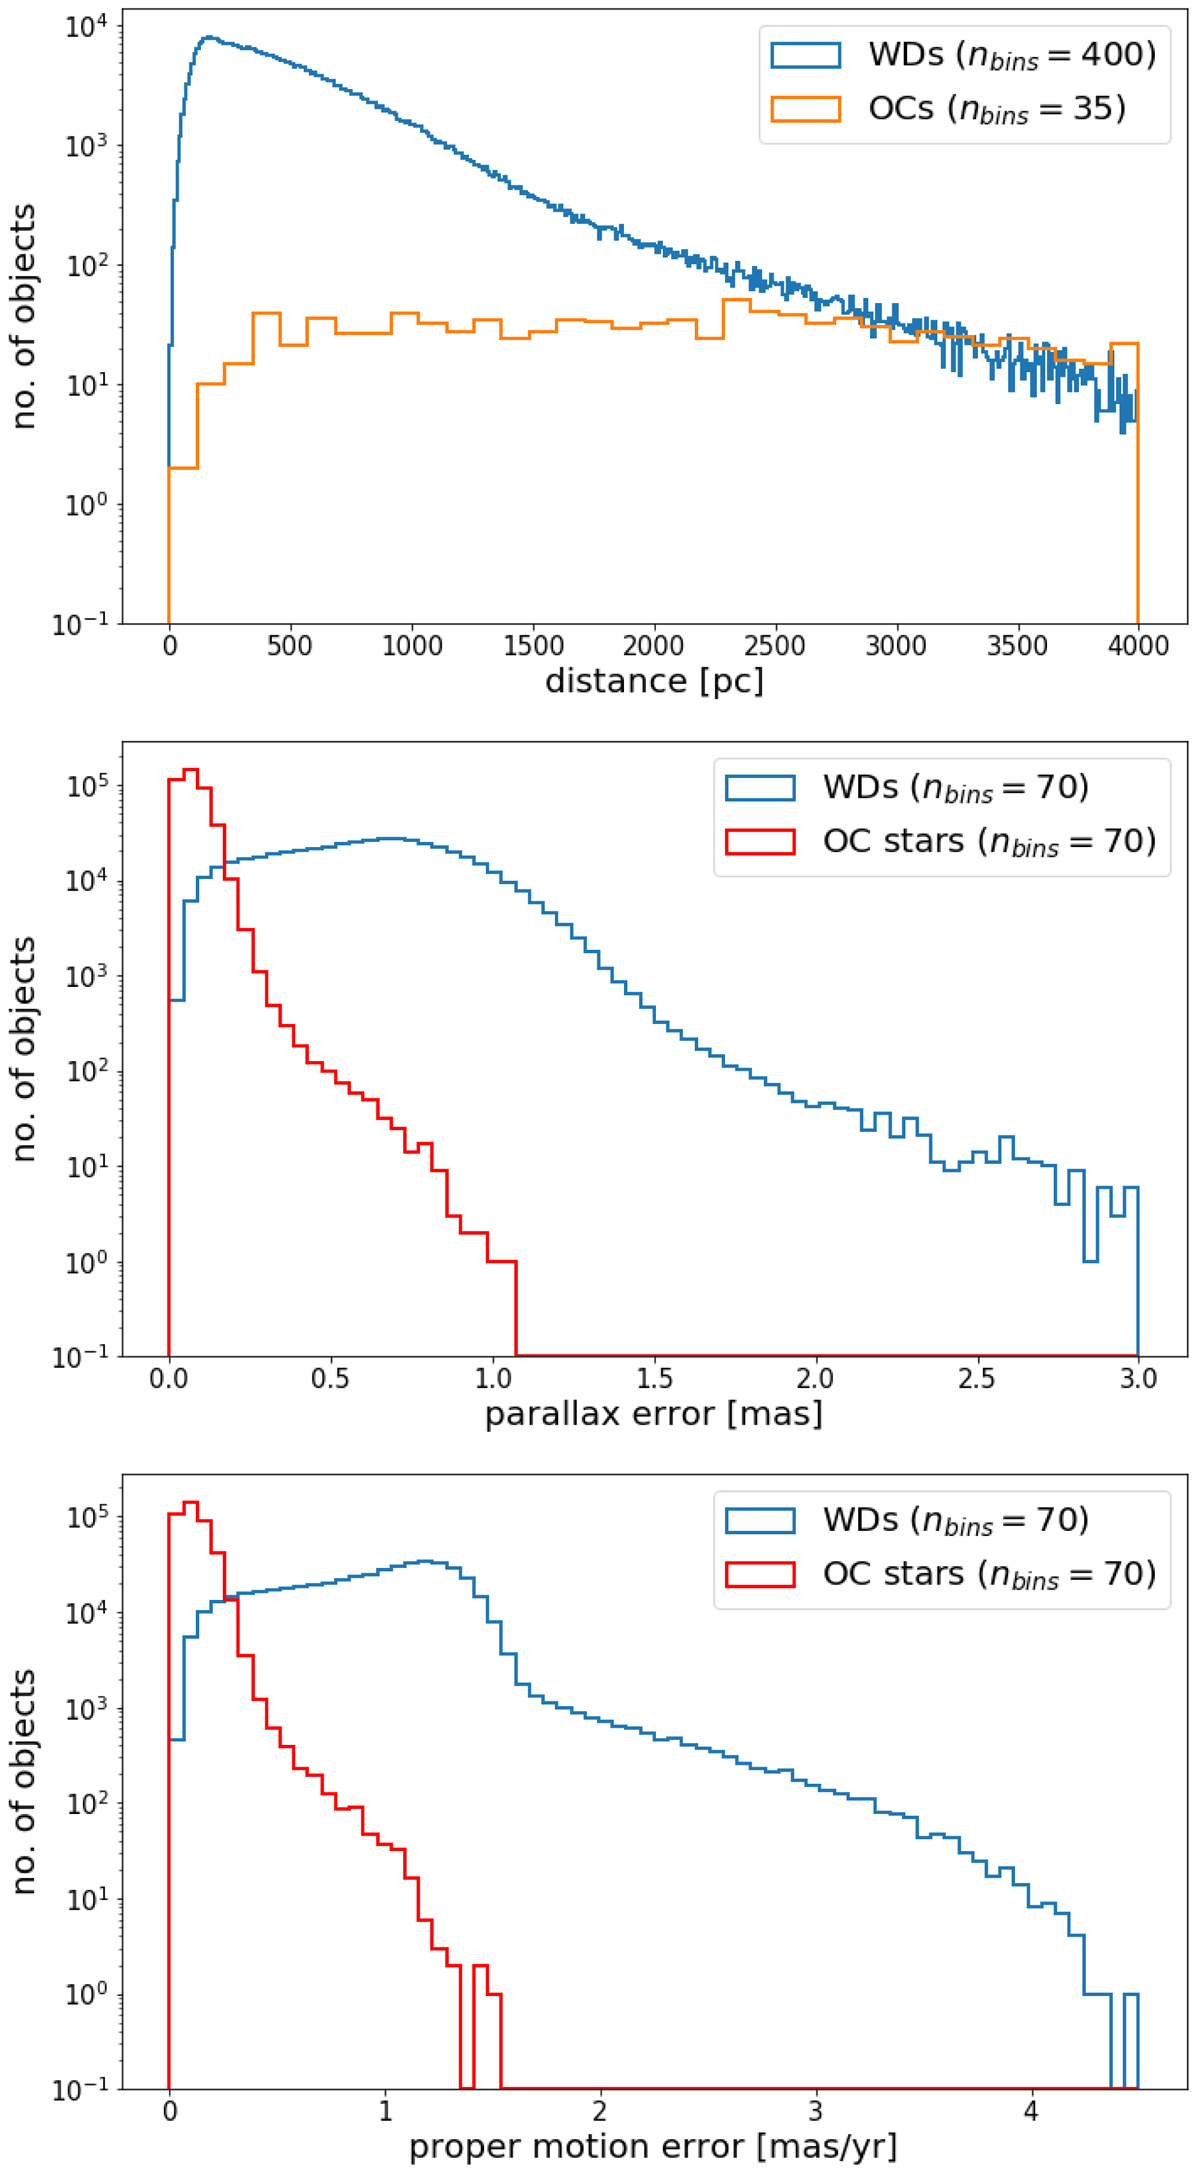
Top: distance distribution of WDs from the catalog of Gentile Fusillo et al. (2019) compared to the distribution of OCs listed in Cantat-Gaudin et al. (2018a). Middle: comparison of the parallax error distribution of the WDs and OC member stars listed in Cantat-Gaudin et al. (2018a). Bottom: comparison of the average proper motion error (average of the RA and Dec components) of the WDs and OC members.
Current usage metrics show cumulative count of Article Views (full-text article views including HTML views, PDF and ePub downloads, according to the available data) and Abstracts Views on Vision4Press platform.
Data correspond to usage on the plateform after 2015. The current usage metrics is available 48-96 hours after online publication and is updated daily on week days.
Initial download of the metrics may take a while.