Fig. 6.
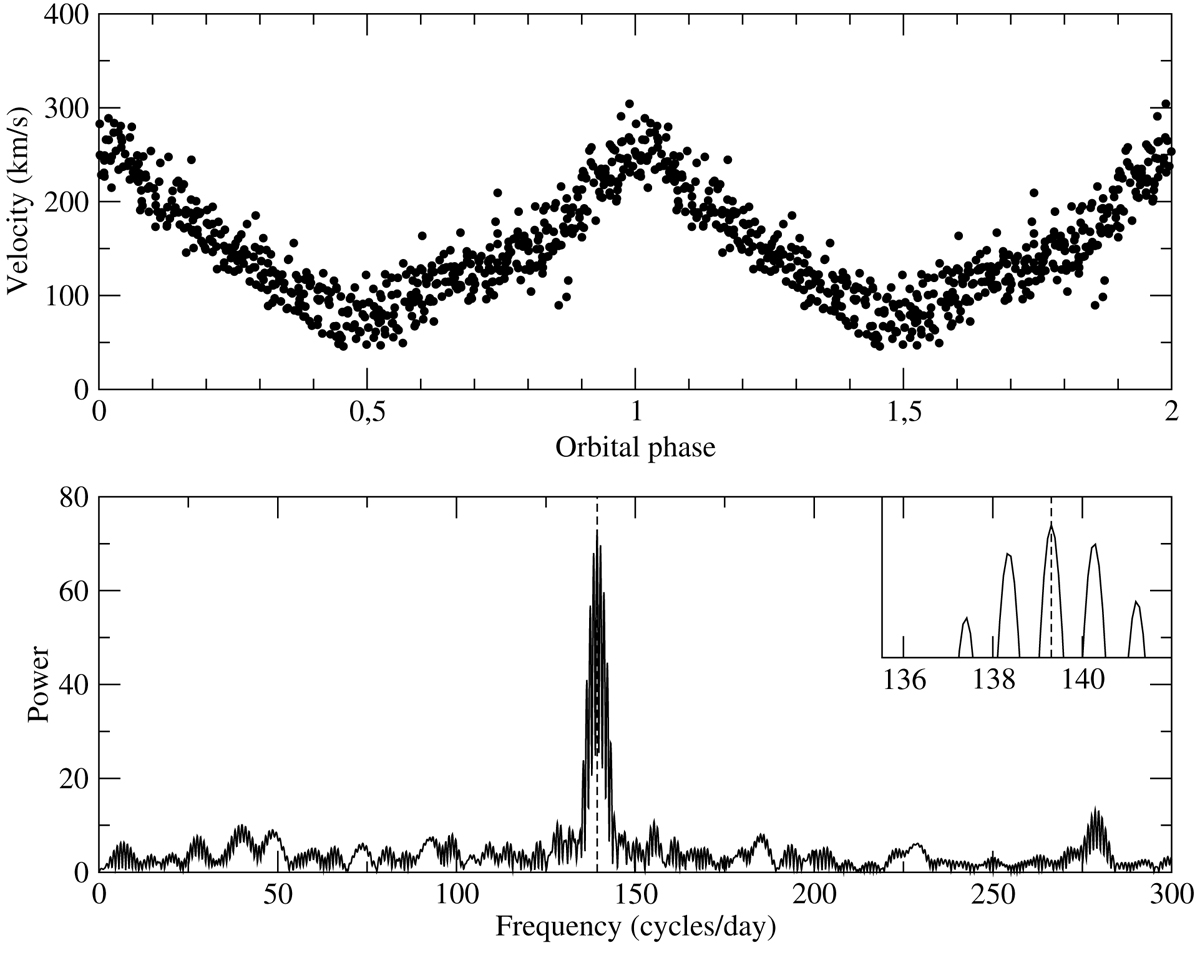
Top panel: radial velocities of the disc through the S-wave measured from the HeII 4686 line folded on the best fitting period. Bottom panel: Lomb-Scargle periodogram for the same line, with a vertical dashed line showing the position of the ephemeris of Copperwheat et al. (2011). A zoom presents a magnified view of the strongest peak.
Current usage metrics show cumulative count of Article Views (full-text article views including HTML views, PDF and ePub downloads, according to the available data) and Abstracts Views on Vision4Press platform.
Data correspond to usage on the plateform after 2015. The current usage metrics is available 48-96 hours after online publication and is updated daily on week days.
Initial download of the metrics may take a while.