Fig. 5.
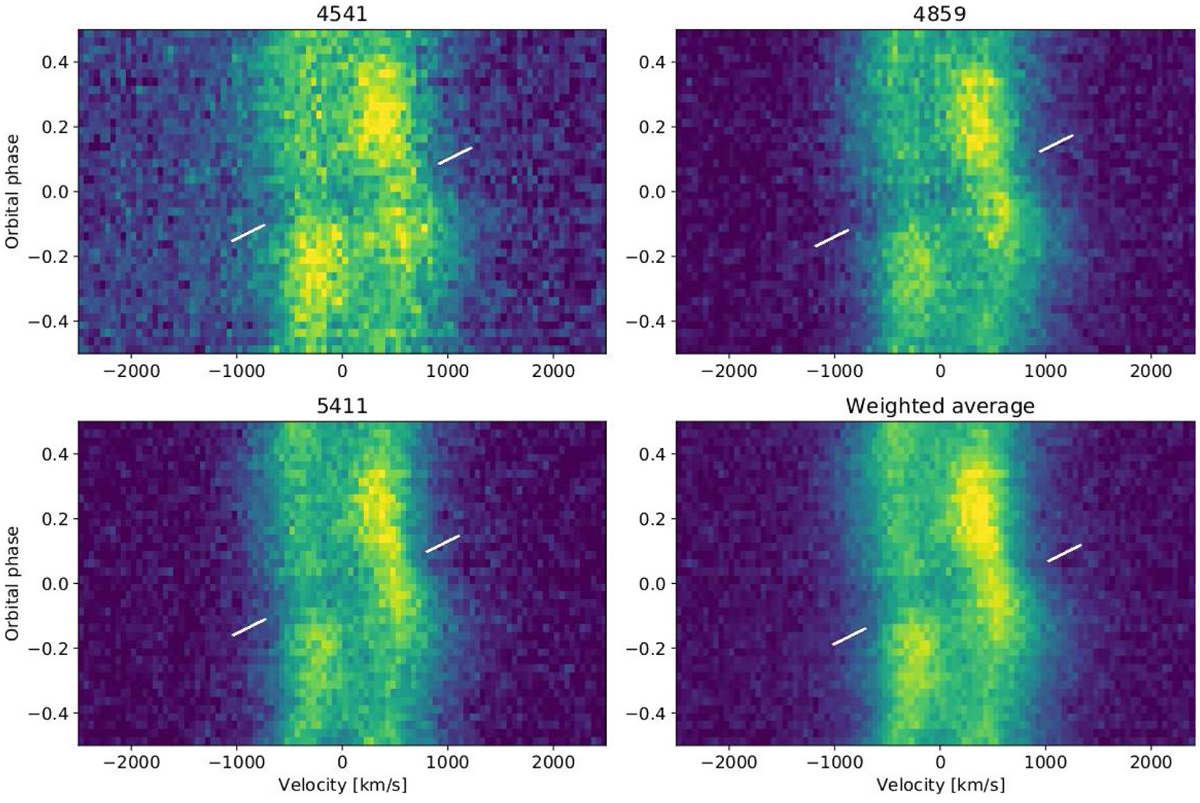
Closeup of the profiles near eclipse in trailed spectra of three of the lines from the Magellan data: HeII 4541 (top left), HeII 4859 (top right), HeII 5411 (bottom left), and the average of these three lines (bottom right). The eclipse is indicated by the white lines and is visible as a darkening around phase 0.0 that slopes upwards from the blue- to the redshifted sides of the lines.
Current usage metrics show cumulative count of Article Views (full-text article views including HTML views, PDF and ePub downloads, according to the available data) and Abstracts Views on Vision4Press platform.
Data correspond to usage on the plateform after 2015. The current usage metrics is available 48-96 hours after online publication and is updated daily on week days.
Initial download of the metrics may take a while.