Free Access
Fig. 1.
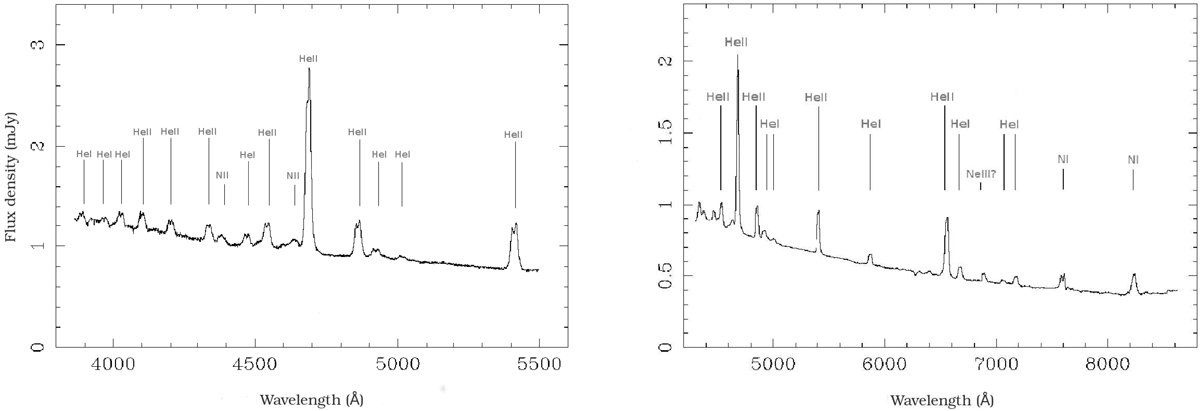
Mean spectra of ES Cet taken with Magellan 2002 October 27−28 (left panel) and the VLT on 2003 October 28 (right panel). All lines can be identified with HeII, HeI and NI, or NII.
Current usage metrics show cumulative count of Article Views (full-text article views including HTML views, PDF and ePub downloads, according to the available data) and Abstracts Views on Vision4Press platform.
Data correspond to usage on the plateform after 2015. The current usage metrics is available 48-96 hours after online publication and is updated daily on week days.
Initial download of the metrics may take a while.