Fig. 8.
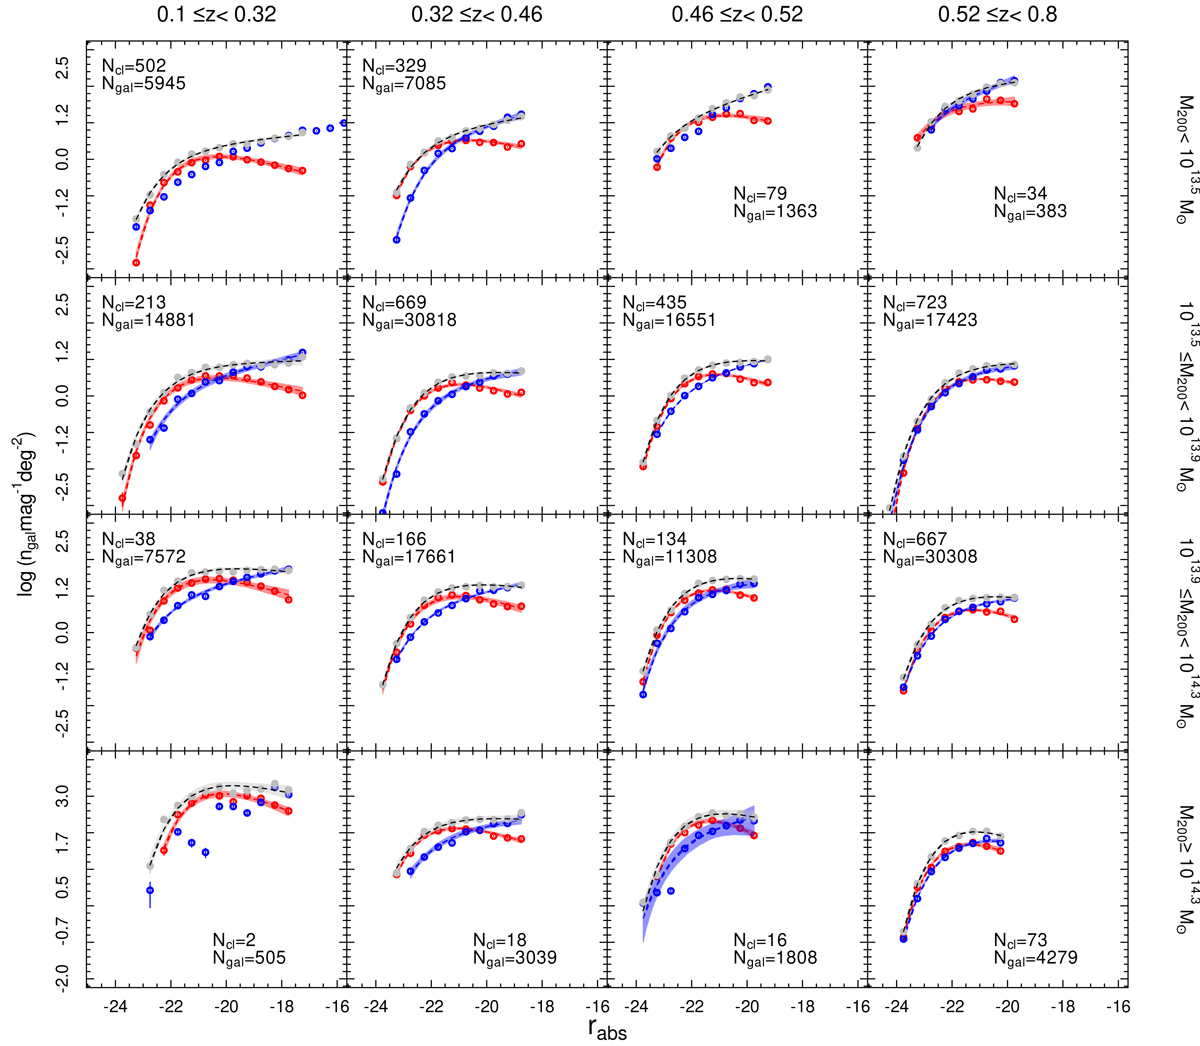
Redshift and richness/mass evolution of the stacked LFs in bin of z and λ⋆ for the total population of galaxies (black dots), red galaxies (red dots), and blue galaxies (blue dots); LF counts are normalized to 1 deg2. The dashed lines are the fit to the Schechter function; the shaded regions enclose the 97.5% confidence interval. In those few cases where the LF cannot be fitted to a Schechter, at least the LF counts are plotted.
Current usage metrics show cumulative count of Article Views (full-text article views including HTML views, PDF and ePub downloads, according to the available data) and Abstracts Views on Vision4Press platform.
Data correspond to usage on the plateform after 2015. The current usage metrics is available 48-96 hours after online publication and is updated daily on week days.
Initial download of the metrics may take a while.