Free Access
Fig. 5.
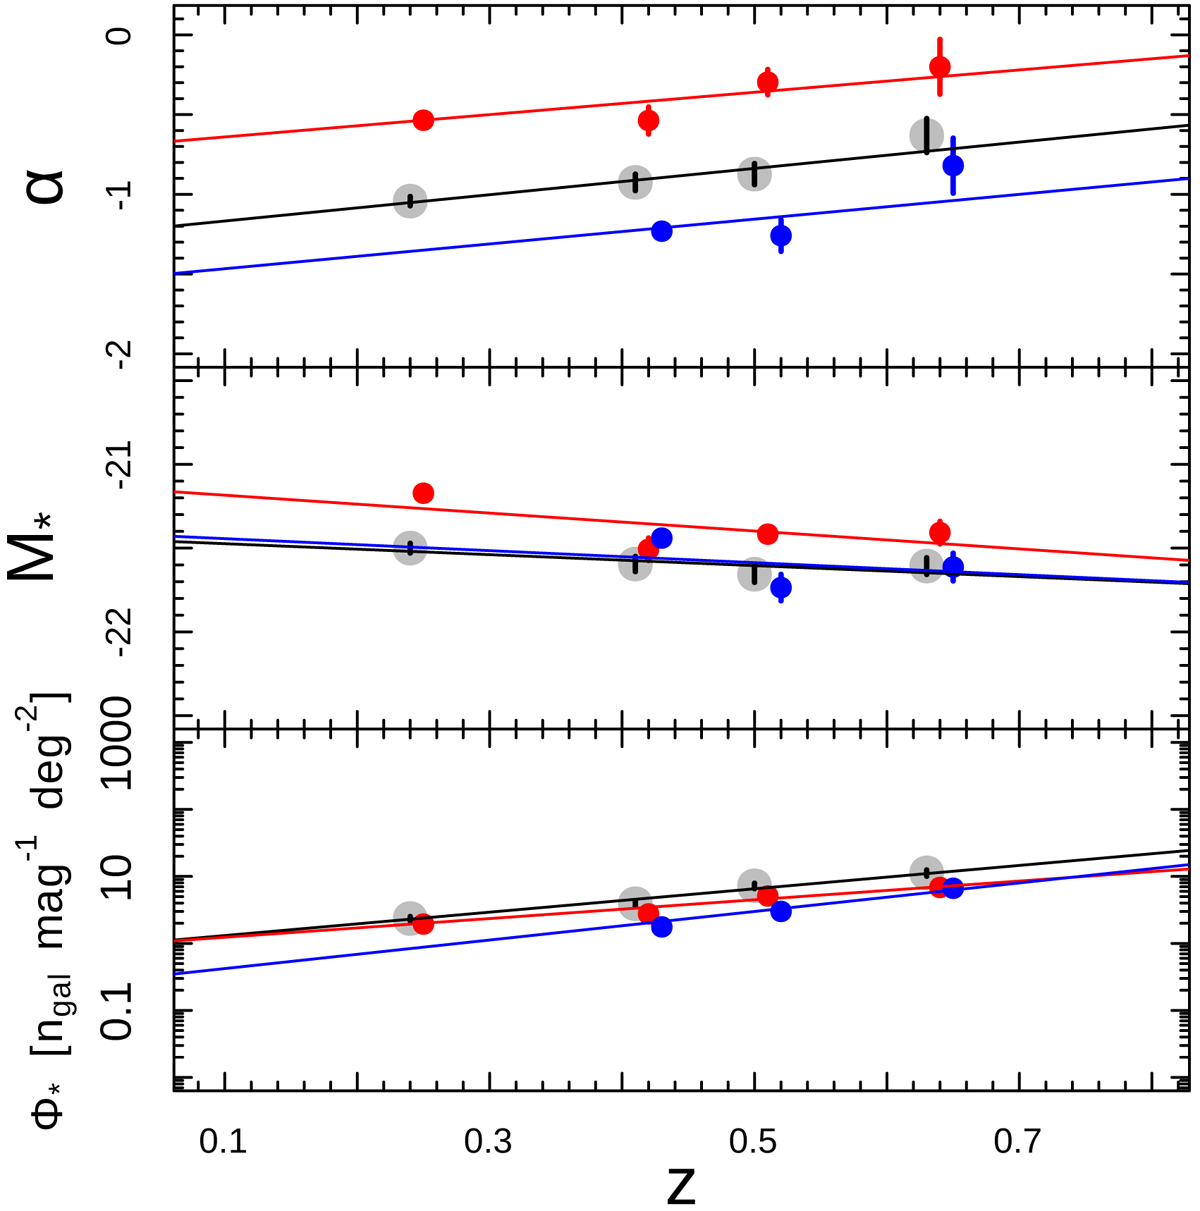
Redshift evolution of the Schechter fit parameters for all galaxies (grey dots), red galaxies (red dots), and blue galaxies (blue dots). The trend lines for all (black lines), red, and blue galaxies are overplotted.
Current usage metrics show cumulative count of Article Views (full-text article views including HTML views, PDF and ePub downloads, according to the available data) and Abstracts Views on Vision4Press platform.
Data correspond to usage on the plateform after 2015. The current usage metrics is available 48-96 hours after online publication and is updated daily on week days.
Initial download of the metrics may take a while.