Fig. 4.
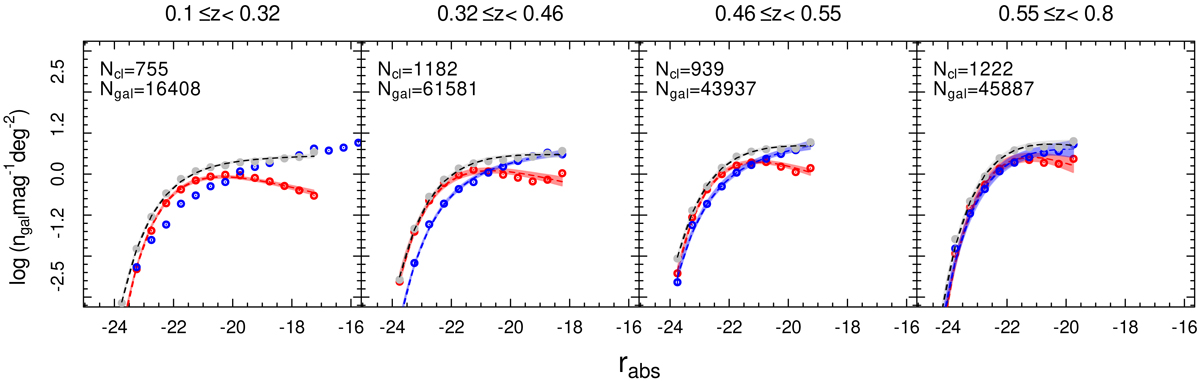
Redshift evolution of the LFs for stacked galaxy clusters in bins of z. The grey, red, and blue dots correspond to the total, red, and blue galaxies LF counts normalized to 1 deg2, respectively. For each panel, the number of clusters contributing to the stacking (Ncl), the total number of galaxies inside r200 belonging to these clusters (Ngal), and the redshift range are reported. The dashed lines (assuming the same colour code) are the fit to the Schechter function; the shaded regions enclose the 97.5% confidence interval. The LF counts are plotted in the two cases of fits that do not converge (left panel, blue galaxy populations), but not the Schechter curves.
Current usage metrics show cumulative count of Article Views (full-text article views including HTML views, PDF and ePub downloads, according to the available data) and Abstracts Views on Vision4Press platform.
Data correspond to usage on the plateform after 2015. The current usage metrics is available 48-96 hours after online publication and is updated daily on week days.
Initial download of the metrics may take a while.