Fig. 3.
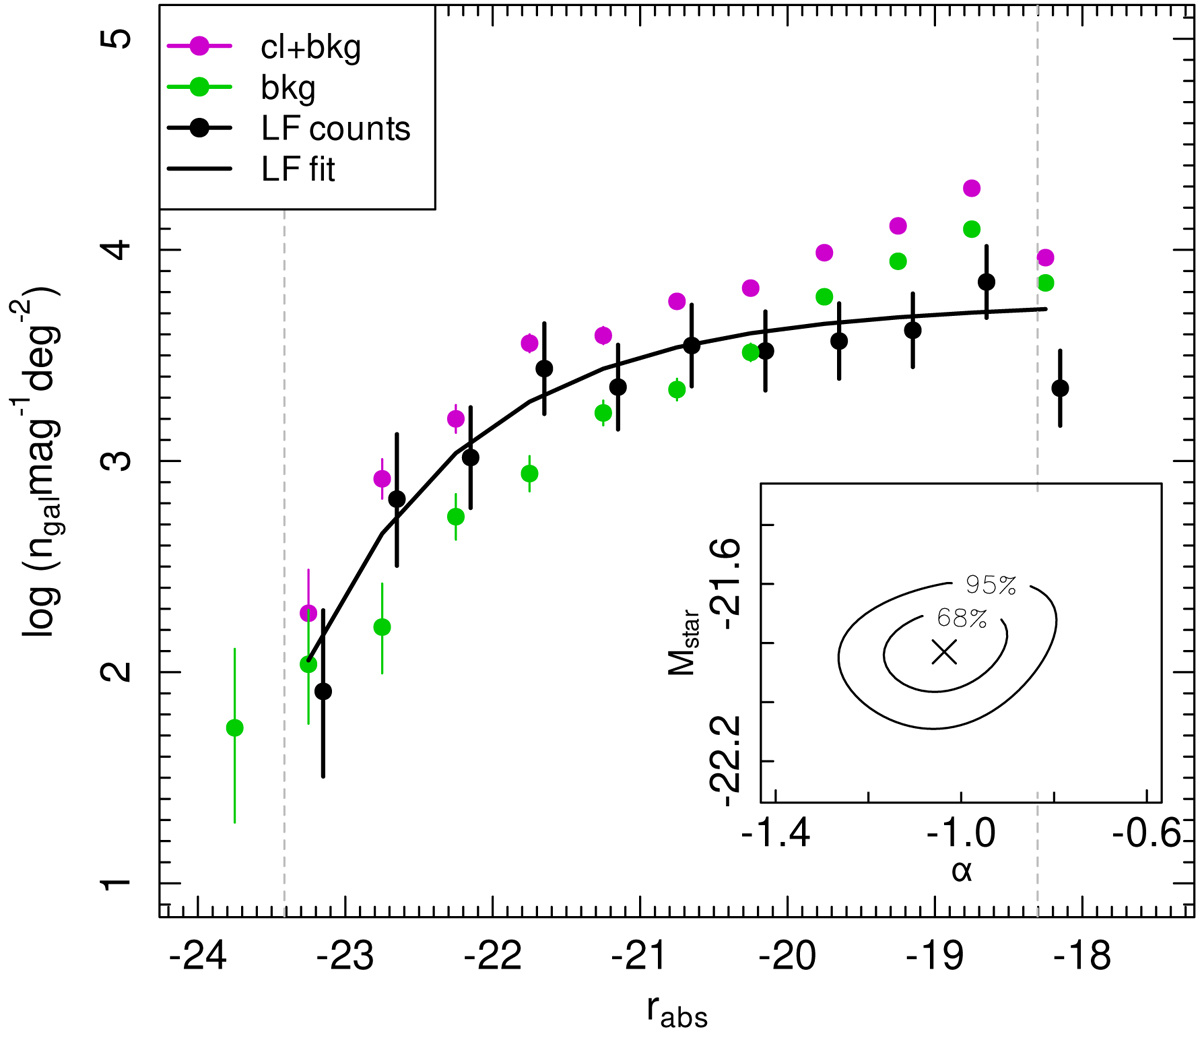
Luminosity function for AK3 J091606.48-002328. The magenta dots represent the total counts coming from the region inside r200; the green dots represent the background counts coming from the background annulus only; and the black dots refer to the background subtracted counts, fitted by a Schechter function (black solid line) in the magnitude range delimited by the two grey vertical dotted lines. Inset: The confidence plot for the values of α and M⋆ resulting from the fit; the contours at 1σ and 3σ are reported.
Current usage metrics show cumulative count of Article Views (full-text article views including HTML views, PDF and ePub downloads, according to the available data) and Abstracts Views on Vision4Press platform.
Data correspond to usage on the plateform after 2015. The current usage metrics is available 48-96 hours after online publication and is updated daily on week days.
Initial download of the metrics may take a while.