Fig. 12.
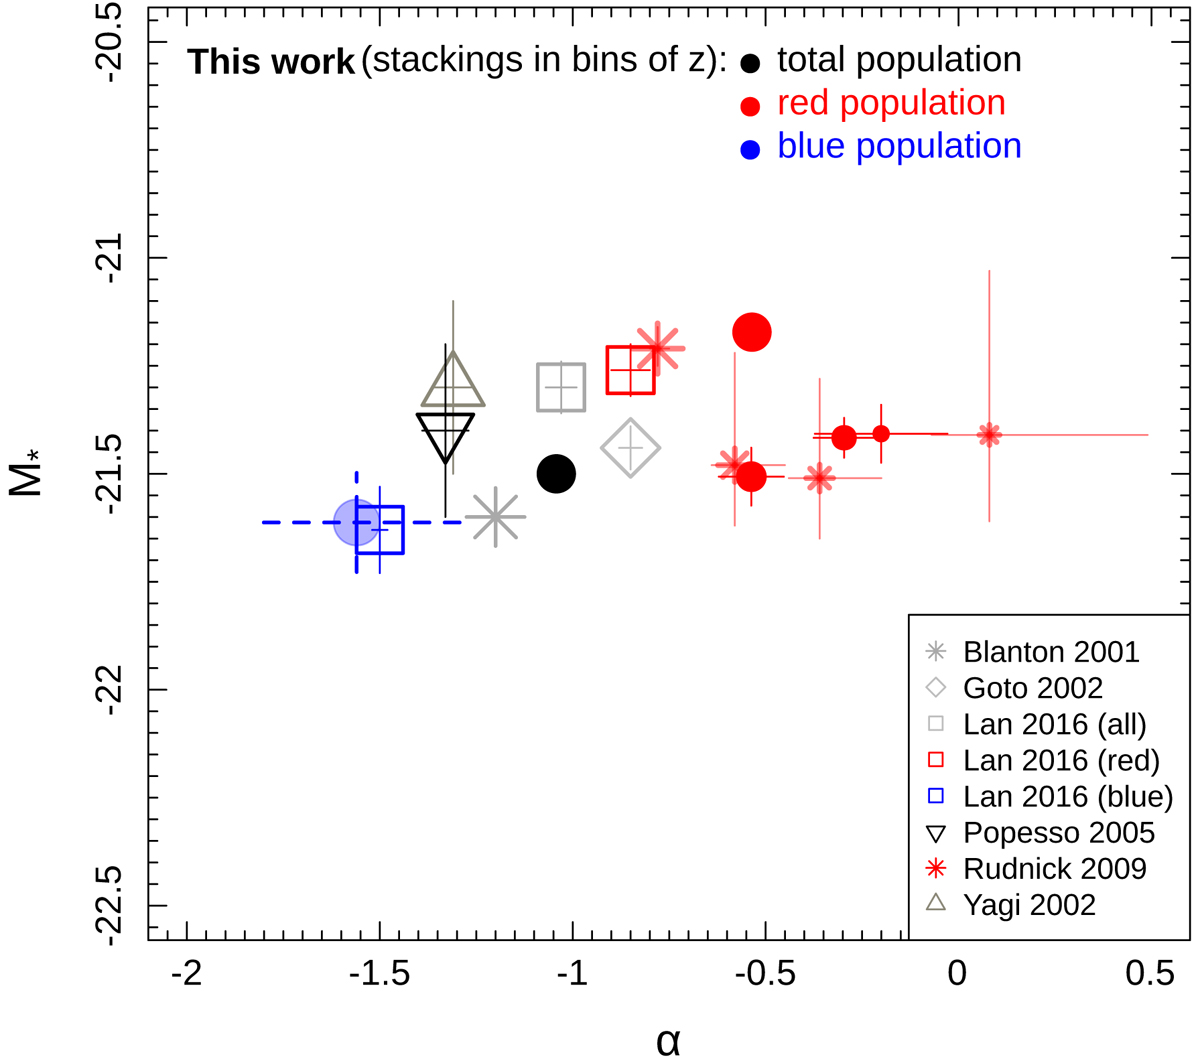
Comparison of our (filled symbols) derivation of the Schechter parameters with previous studies of composite LFs in the literature (empty symbols). Our red and total population parameters are those represented in Fig. 5 and were obtained by stacking LFs in bins of z at all richnesses; the single pale blue dot represents the estimate of our blue parameters by Eq. (5). The dimension of each symbol is inversely proportional to the median redshift of the z-bin. This also holds for the parameters from literature, where the used redshift is the median computed over the survey range.
Current usage metrics show cumulative count of Article Views (full-text article views including HTML views, PDF and ePub downloads, according to the available data) and Abstracts Views on Vision4Press platform.
Data correspond to usage on the plateform after 2015. The current usage metrics is available 48-96 hours after online publication and is updated daily on week days.
Initial download of the metrics may take a while.