Free Access
Fig. 11.
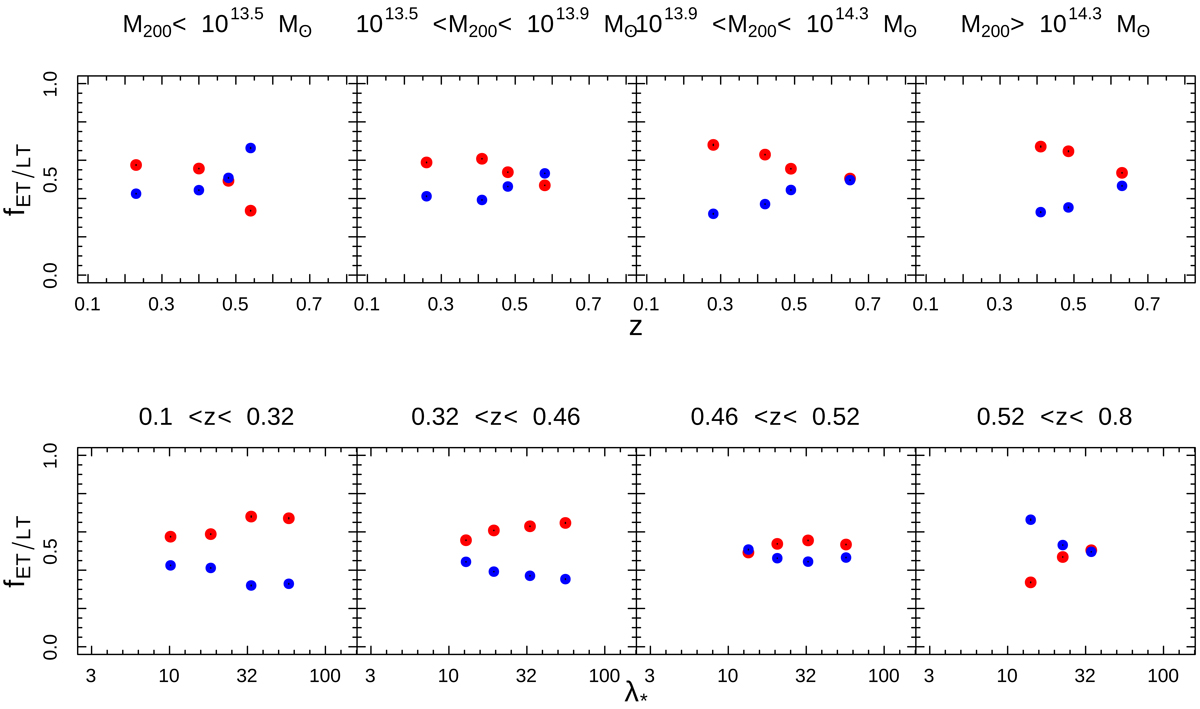
Red/blue galaxy fraction redshift evolution in richness/mass bins (upper panels) and red/blue galaxy fraction dependence on mass in redshift bins (lower panels). The red/blue dots represent the red/blue population, respectively. The error bars are smaller than the symbols size.
Current usage metrics show cumulative count of Article Views (full-text article views including HTML views, PDF and ePub downloads, according to the available data) and Abstracts Views on Vision4Press platform.
Data correspond to usage on the plateform after 2015. The current usage metrics is available 48-96 hours after online publication and is updated daily on week days.
Initial download of the metrics may take a while.