Fig. 6
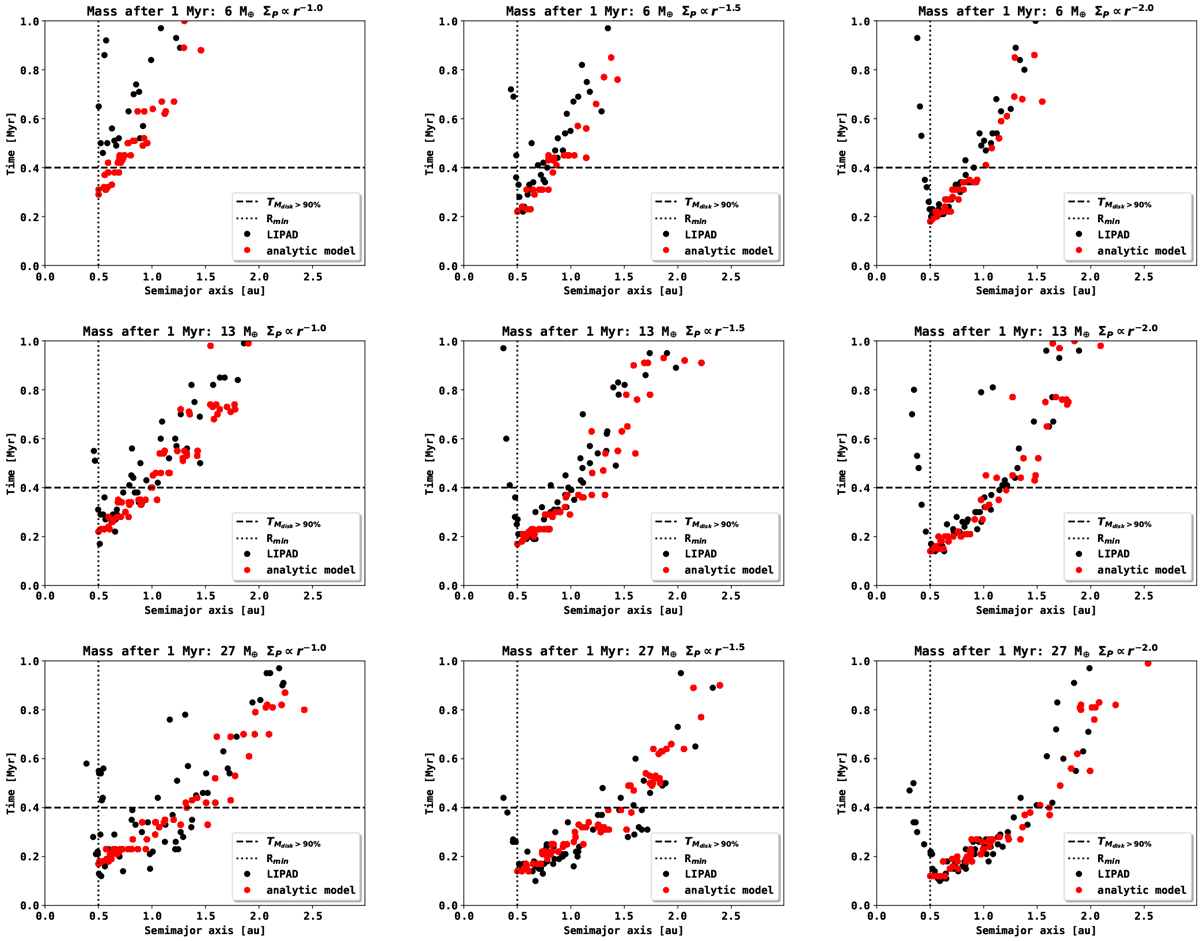
Analytical model for embryo formation and embryo formation in LIPAD. The black dots indicate the time and location at which an object reached planetary embryo mass in the LIPAD simulations. The red dots indicate the time for each distance from the star at which a planetary embryo is placed using ouranalytical model. The orbital separation as input to the analytical model is given as 17 RHill, with a randomization of 2.5 RHill The inner edge of planetesimal formation in the LIPAD runs was chosen to be at 0.5 au for numerical performance. We vary the total mass in planetesimals after 106 yr from 0.5 to 5 au (6 M⊕,13 M⊕, and 27 M⊕) and the planetesimal surface density slope (ΣP ∝ r−1.0, ΣP ∝ r−1.5, and ΣP∝ r−2.0).
Current usage metrics show cumulative count of Article Views (full-text article views including HTML views, PDF and ePub downloads, according to the available data) and Abstracts Views on Vision4Press platform.
Data correspond to usage on the plateform after 2015. The current usage metrics is available 48-96 hours after online publication and is updated daily on week days.
Initial download of the metrics may take a while.