Fig. 3
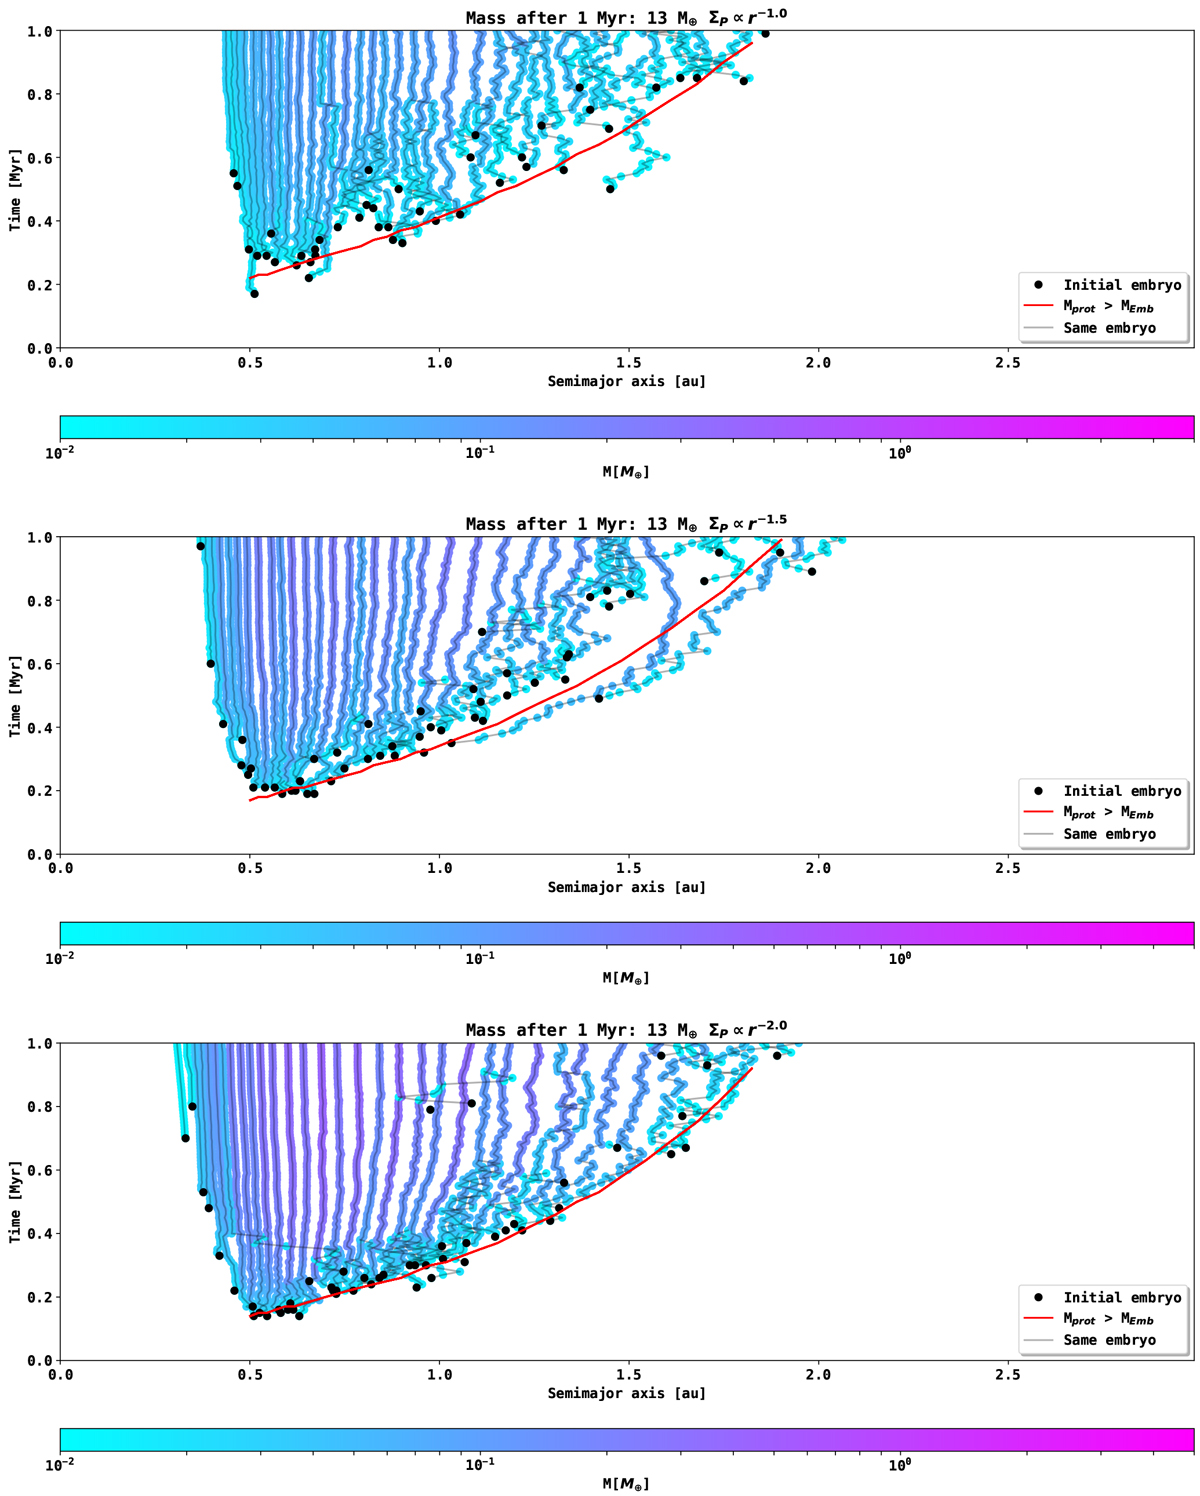
Time over semimajor axis evolution of the N-body simulation in LIPAD. The time and location at which an object has first reached lunar mass is indicated by the black dots in the plot. The subsequent growth of the embryo is tracked and connected with the gray lines (its mass is given by the color bar). The mass after one million years in planetesimals is 13 M⊕ in these runs. The planetesimal surface density slope is varied (ΣP ∝ r−1.0, ΣP ∝ r−1.5, and ΣP∝ r−2.0 ). The red line indicates where Mprot surpasses the mass of a lunar-mass planetary embryo in the analytical model from Sect. 2.2, assuming the same evolution of the planetesimal surface density that is given to the N-body simulation.
Current usage metrics show cumulative count of Article Views (full-text article views including HTML views, PDF and ePub downloads, according to the available data) and Abstracts Views on Vision4Press platform.
Data correspond to usage on the plateform after 2015. The current usage metrics is available 48-96 hours after online publication and is updated daily on week days.
Initial download of the metrics may take a while.