Fig. 7.
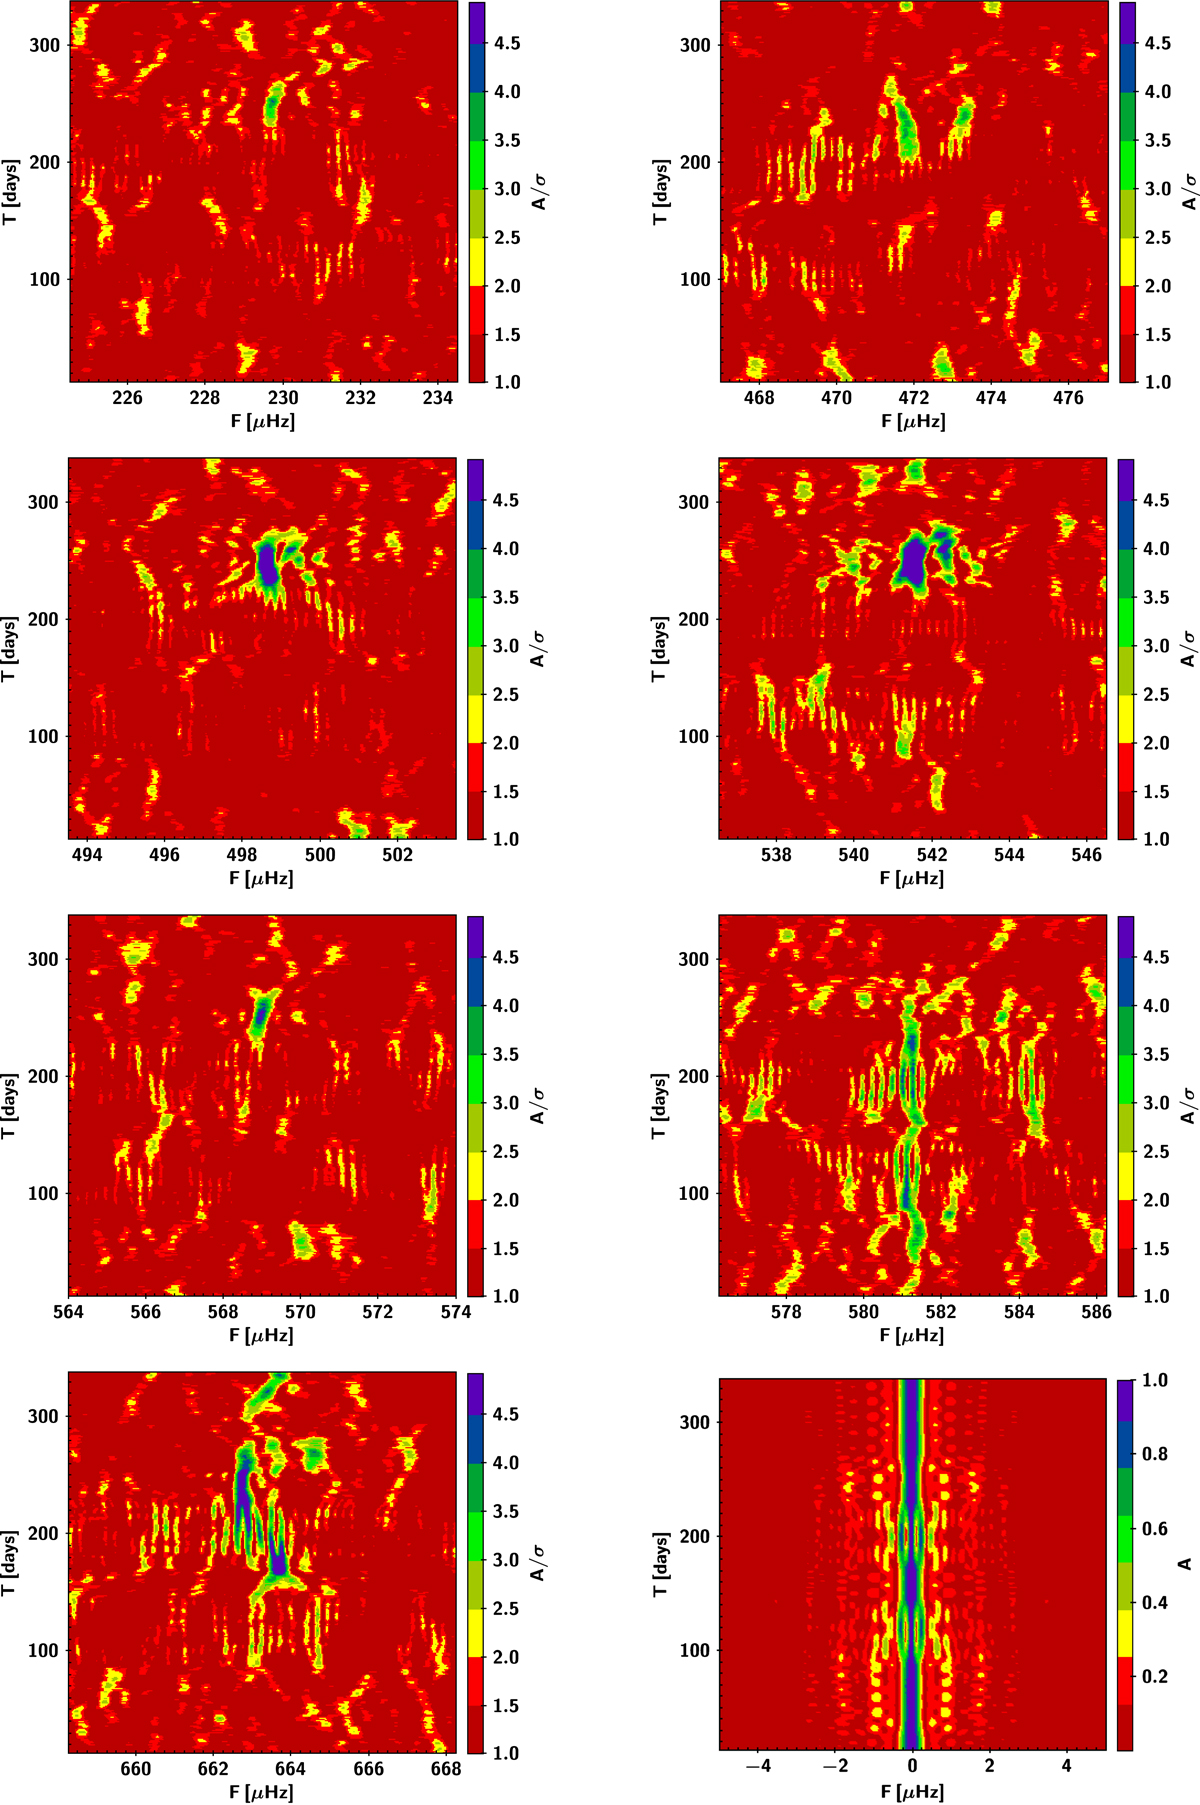
Panels 1–7: sliding FT of K 1−16 centered on the peaks at ∼229.7, ∼471.7, ∼498.7, ∼541.6, ∼569.0, ∼581.3, and ∼663.0 μHz. The color-coded amplitudes are given in σ units, i.e., amplitude divided by the mean noise of each FT. The oscillations are not stable over the course of the TESS observations, and in the first ≈200 days (up to Sector 22) some of the modes are absent. Panel 8: sliding WF obtained using a single sinusoid of constant frequency and constant amplitude of one, without any noise. The frequency scale is the same in all panels. See text for more details on sFT and sWF computations.
Current usage metrics show cumulative count of Article Views (full-text article views including HTML views, PDF and ePub downloads, according to the available data) and Abstracts Views on Vision4Press platform.
Data correspond to usage on the plateform after 2015. The current usage metrics is available 48-96 hours after online publication and is updated daily on week days.
Initial download of the metrics may take a while.