Fig. 5.
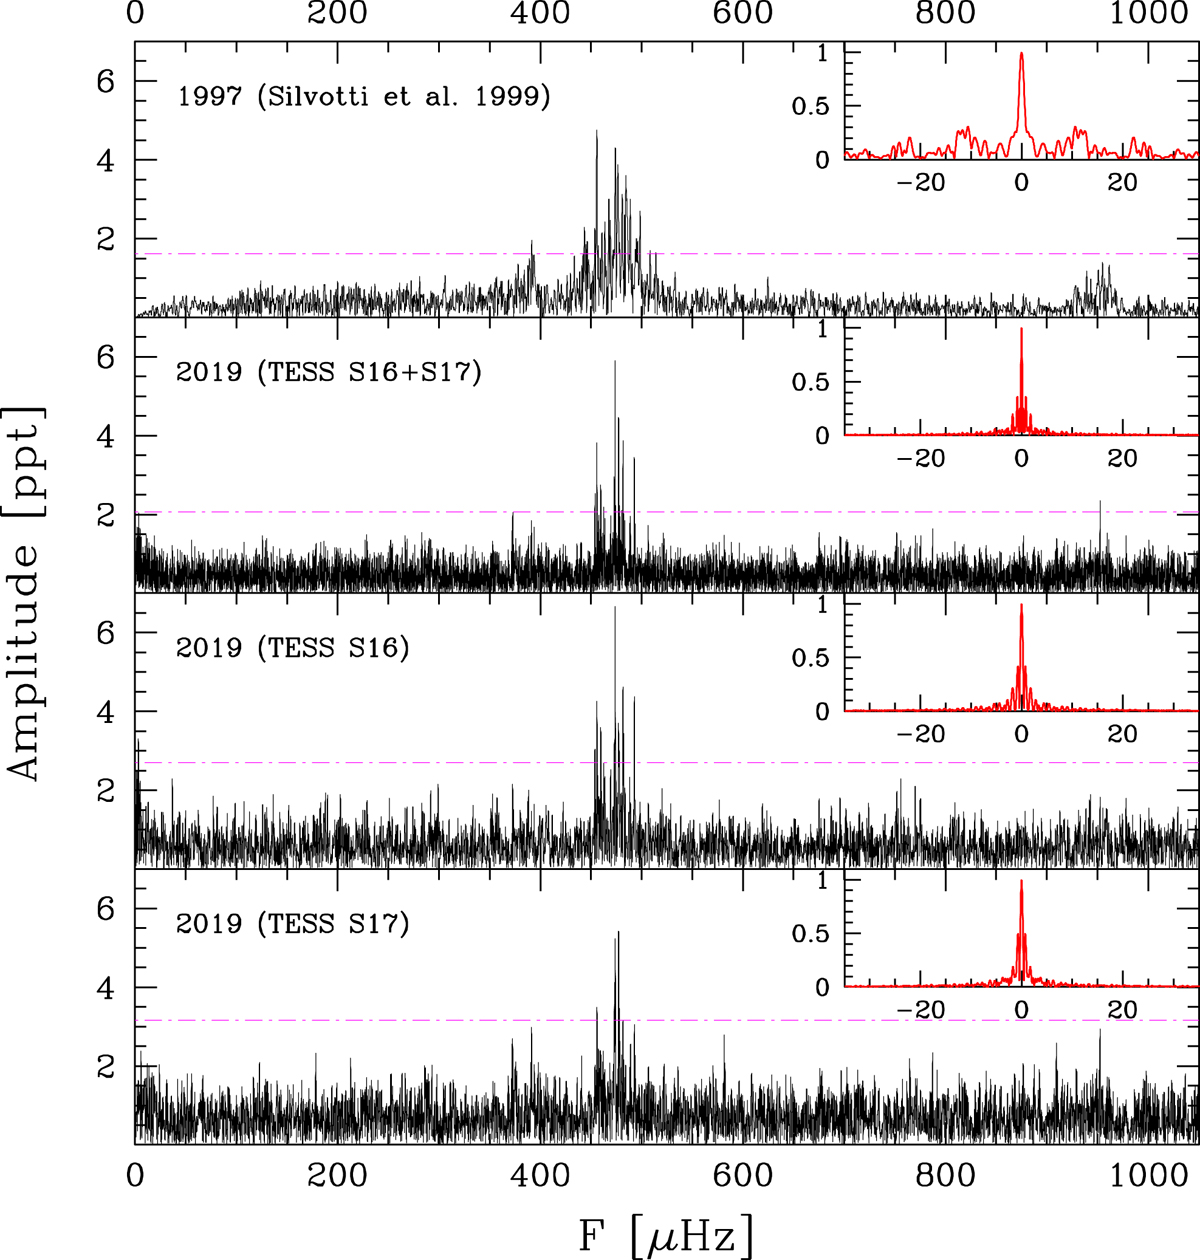
Comparison between the amplitude spectrum of HS 2324 in 1997 (Silvotti et al. 1999) and 2019 (TESS data). The detection threshold (dash-dotted magenta line) in 2019 is slightly higher (2.07 ppt with sector 16 and 17 together vs. 1.62 ppt in 1997), but the spectral window (red, upper right panels) is much cleaner. This partially explains the higher density of the peaks in 1997. The low level of noise below ∼100 μHz in 1997 is due to artificial filtering.
Current usage metrics show cumulative count of Article Views (full-text article views including HTML views, PDF and ePub downloads, according to the available data) and Abstracts Views on Vision4Press platform.
Data correspond to usage on the plateform after 2015. The current usage metrics is available 48-96 hours after online publication and is updated daily on week days.
Initial download of the metrics may take a while.