Fig. 33.
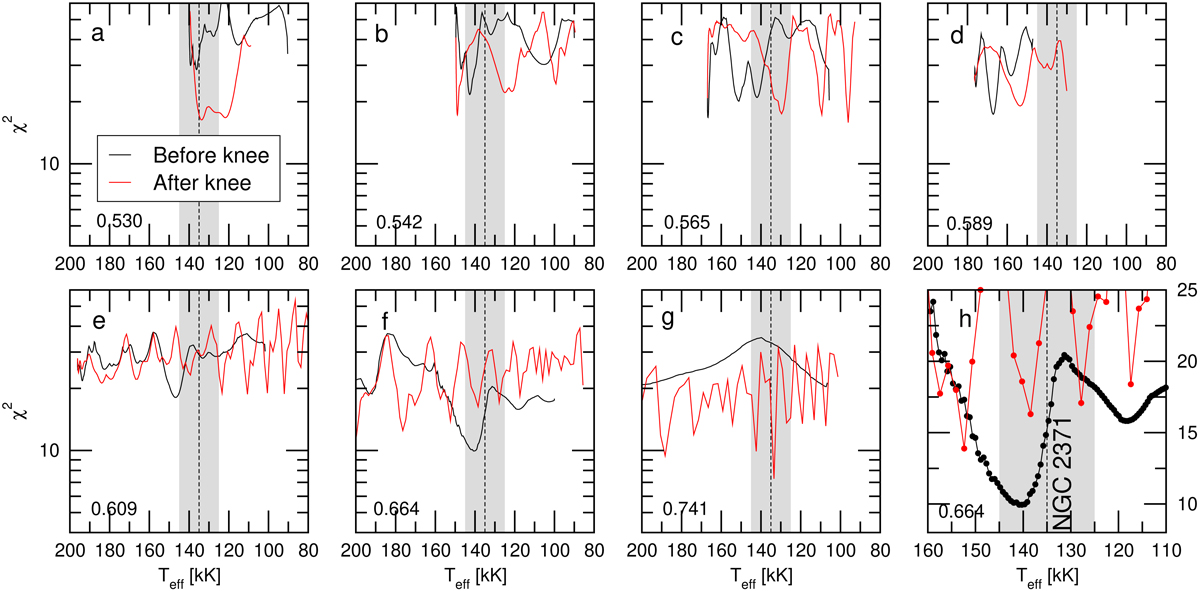
Same as Fig. 26, but for NGC 2371. The minimum in panel f before the evolutionary knee (black curve) corresponds to M⋆ = 0.664 M⊙. Panel h is a zoom of the region with the strong minimum seen in panel f; the y-axis scale is linear in this case. The vertical dashed line is the spectroscopic Teff of NGC 2371 (135 kK), and the gray zone depicts its uncertainties (±10 kK).
Current usage metrics show cumulative count of Article Views (full-text article views including HTML views, PDF and ePub downloads, according to the available data) and Abstracts Views on Vision4Press platform.
Data correspond to usage on the plateform after 2015. The current usage metrics is available 48-96 hours after online publication and is updated daily on week days.
Initial download of the metrics may take a while.